From Discussions VOL. 12 NO. 2Do Healthcare Systems Discriminate? A Comparative Policy Analysis of Health Inequality in the United States and United Kingdom
IN THIS ARTICLE
KEYWORDS
AbstractThis comparative analysis of U.S. and U.K. healthcare systems pinpoints inequalities in health outcomes and recommends policies to alleviate disparities. Mortality data from the CDC'S WONDER Database and Cancer Research U.K. were used to analyze two gendered conditions – female breast cancer and male prostate cancer– for mortality rates and relative mortality ratios by region, race, and socioeconomic status. The data indicate that although the United States outperforms the United Kingdom in overall mortality rates for breast and prostate cancers, outcomes for U.S. Black residents are significantly worse than those for U.K. Black residents. Potential sources of inequality are discussed with special focus on the structural differences yielding better minority outcomes in the U.K. Policy changes that reduce U.S. health disparities will save lives and ensure that each individual possesses a healthy foundation for a rewarding life. IntroductionThe U.S. has long maintained its distinction as the only advanced economy lacking a universal healthcare system that guarantees health care as a right of all citizens. As a result, inequality of access has yielded stark differences in health outcomes among socioeconomic classes, races, and genders. However, countries with universal health systems, such as the U.K., also struggle with some of the same disparities observed in the U.S. The question of achieving economic justice within healthcare systems is critical because reduction in health disparities will improve longevity and quality of life for all. The United Kingdom's National Health ServiceThe National Health Service (NHS) of England is a publicly funded, universal system that aggressively manages the price and availability of health care goods and services. There are two major branches of the NHS: direct NHS commissioning and local planning committees, the latter of which were originally called primary care trusts (PCTs). Under the Health and Social Care Act of 2012, the PCTs were reformed into 211 clinical commissioning groups (CCGs), which still plan and purchase health care services for local populations but incorporate greater leadership from clinicians (Taylor, 2014, p. 7). Direct NHS commissioning provides specialized healthcare services in technical hospital centers in addition to funding primary care for all citizens and health services for the armed forces and incarcerated population (Taylor, 2014, p. 12). The CCGs then allocate funding for urgent and emergency care, elective hospital care, maternal and newborn health, and mental health for communities of approximately 250,000 people (Taylor, 2014, p. 13). Most distinctive is the U.K.'s strict funding and cost control measures. The treasury initially allocated approximately £107 billion ($162.5 billion) per annum for general health care expenditure (Taylor, 2014, p. 10). NHS England received £96 billion ($145.8 billion) of this sum from 2012 to 2013, of which the body retained £30 billion for direct commissioning services (Taylor, 2014, p. 11). The rest of the funding is allocated to CCGs on a weighted capitation basis, with budgets determined by the size of the population and adjusted for population age and health. Budgets to CCGs are provided either as lump-sum block contracts or as payment-by-results contracts, which provide funding for outcomes rather than services at an agreed-upon price. As financial pressures force the NHS to achieve better outcomes with existing resources, payment-byresults is being used more frequently, composing an unprecedented 30% of all contracts (Taylor, 2014, p. 10). A critical U.K. cost management tool is the National Institute for Health and Care Excellence (NICE), a research arm that provides evidence-based advice and legally binding treatment recommendations. NICE uses the incremental cost-effectiveness ratio to determine if a new treatment is an improvement over existing technologies. NICE has a soft upper cost-effectiveness limit of £20,000 to £30,000 ($30,377 to $45,565) per quality-adjusted life year (QALY) offered by a new treatment, a standard unchanged since 2004 (Claxton, K., Martin, S., Soares, M., Rice, N., Spackman, E., et al., 2013, p. 6). The probability that any given treatment approved by the NHS is under the £20,000 threshold is 64% while 92% of approved treatments are under the £30,000 threshold (Claxton et al., 2013, p. 10). The tremendous focus on cost-effectiveness means that expensive treatments that only marginally extend or improve life are often rejected. While there is national concern about cost control, the vast majority of medical services offered by the NHS are free for U.K. citizens at the point of delivery (NHS Choices, 2015). Most patients only make copayments toward the cost of prescriptions, dental care, and eye care, with funds redirected back into the NHS trust. 2015 NHS prescription costs average to £8.20 ($12.45) per drug, but medications are free if they are administered at a hospital or personally prescribed by a general practitioner (GP) (NHS Choices, 2015). If these additional costs are too burdensome, U.K. residents may apply to the NHS Low Income Scheme to receive reduced or free co-payments in addition to reimbursed travel costs for diagnosis and treatment at public facilities. The United States' Mixed Economic Health ConglomerateIn contrast lies the market-oriented public and private insurance conglomerate of the U.S. The public sector is one of the three financing arms of the U.S. healthcare system, providing Medicaid for low-income individuals, Medicare for the elderly and long-term disabled people, and medical services through the Veterans Administration for retired armed forces personnel. The private sector and direct-from-consumer expenditures in the form of out-of-pocket (OOP) costs compose the other two financing sources (Barton, 2010, p. 4). In 2010, these expenditures totaled $2.59 trillion, representing 17.9% of U.S. GDP and the highest per capita health spending in the world (Barton, 2010, p. 11). Unlike the NHS, the U.S. healthcare system does not have a regulatory division that approves only cost-effective treatments. Instead, U.S. private payers individually negotiate with healthcare providers in an obscure process leading to regional discrepancies in provider reimbursement levels and care costs (Squires, 2012, p. 11). U.S. healthcare expenditure is controversial in its lack of success in achieving the best worldwide health outcomes despite the high per capita expenditure. As a result, the Patient Protection and Affordable Care Act (PPACA) of 2010 attempted to improve health outcomes while controlling rising costs. Major provisions included mandating access to health insurance regardless of pre-existing conditions, requiring individuals to purchase a minimum level of health insurance, mandating coverage of preventative medical services, and creating either state or federal health exchanges for individuals lacking access to employer-based insurance. Furthermore, the law extended coverage for dependents, increased emphasis on comparative effectiveness research, and highlighted the importance of primary care medicine through the designation of personal GPs as "medical homes" (Barton, 2010, p. 22). Rather than using national taxation to fund medical care like the NHS does, the U.S. healthcare system features a dizzying array of insurance payment plans. Depending on specifics, insurance plans can hold the consumer responsible for paying a monthly premium simply to gain access. In addition to this premium, insurance companies use a number of other payment mechanisms to deter excessive medical care. Co-insurance requires consumers to pay a specific percentage of their total medical expenses, making consumers consider prices before selecting among treatment options. To further deter expensive care, insurers use co-payments, a type of point-of-service fee, as well as deductibles, which are OOP expenditure thresholds that must be paid by the consumer before the health insurance plan begins providing coverage for services. These mechanisms, in combination with the managed care systems of the U.S, were intended to control costs but failed to decelerate the growing rate of health expenditure (Barton, 2010, p. 22). "U.S. healthcare expenditure is controversial in its lack of success in achieving the best worldwide health outcomes despite the high per capita expenditure." These fundamental differences in the U.S. and U.K. health systems may explain the varying outcomes observed in the relative mortality rates by race for two conditions: female breast cancer and male prostate cancer. These conditions were selected because they encompass the adult experience at both middle and later stages of life. These conditions affect a larger proportion of the population, providing an adequate sample size for data analysis while controlling for gender. As some of the most common causes of death for both the U.S. and U.K, the selected diseases represent significant challenges to life quality and longevity for the Western world. Eliminating disparities in these large disease pools will have a profound impact on eliminating disparities in all of medicine. MethodsResearch methods were dictated by the U.K.'s availability of information. While the U.S. has free public access to mortality data, the U.K.'s data on health outcomes by race were limited (Thomson & Forman, 2009). To establish a baseline for outcome differences among various ethnicities, researchers linked data from the National Cancer Intelligence Network to medical records through the Hospital Episode Statistics, allowing the calculation of mortality rates for a variety of conditions by race. Thus, where reliable data for the U.K. could be located, equivalent incidence and mortality data were generated for the U.S. from the CDC's WONDER (Wide-ranging Online Data for Epidemiologic Research) Mortality Database. Data for breast cancer in the U.K. came from two sources. The most recent mortality rates include the female age-standardized rates (ASRs) per 100,000 for breast cancer (ICD-10 Code 50) in the U.K. in 2012 (Cancer Research UK, 2014a). The only source of data for mortality by race is a report entitled Cancer Incidence and Survival By Major Ethnic Group, England, 2002 2006 (Thomson & Forman, 2009). This source provides cancer incidence rates per 100,000 people for White, Asian, Black, Chinese, and mixed races, which can be used to calculate relative ratios. Data for breast cancer in the U.S. come from the CDC'S WONDER Database on U.S. Cancer Statistics, 1999 to 2012 (CDC WONDER, 2012). For cancer incidence, the database for cancer incidence from 1999 to 2012 was used. Outputs were sorted by cancer sites, region, and race. ASRs were selected, and query factors were as follows: "all regions," "female only," "all ethnicities and races," and "all ages." Years selected were 2002 through 2006, inclusive. The cancer of interest was "female breast," and the 2000 U.S. standard was used for the ASRs. For cancer mortality, the database for cancer mortality from 1999 to 2012 was used. Outputs were sorted again by cancer sites, region, and race. ASRs were selected based upon the 2000 U.S. standard population. All regions, ages, races, and ethnicities were selected. Only females were selected, and the cancer of interest was "female breast" for the year 2012.
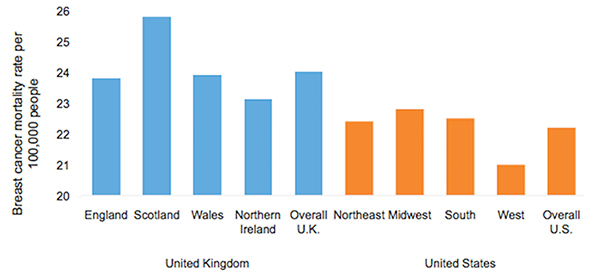
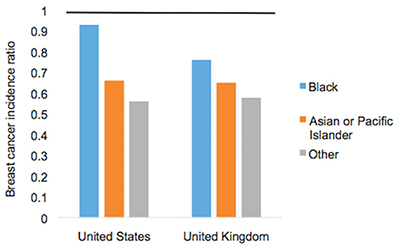
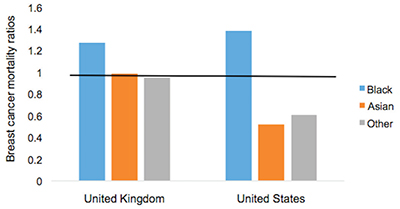
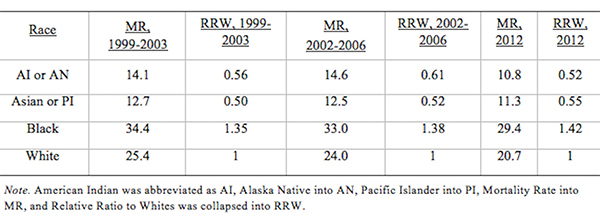
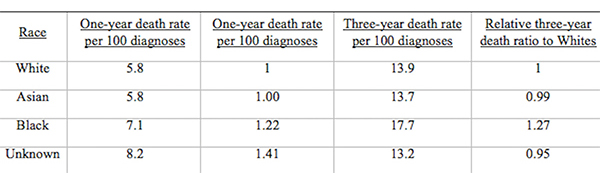
Figure 1. Female Breast Cancer Incidence and Mortality Data. Age-standardized breast cancer mortality rates per 100,000 people by country and region, 2012. Data for prostate cancer in the U.K. come from two sources. The most recent mortality rates include the male ASRs per 100,000 for prostate cancer (ICD-10 Code 61) in the U.K. in 2012 (Cancer Research UK, 2014b). The only source of data about mortality by race is a report entitled Cancer Incidence and Survival By Major Ethnic Group, England, 2002 2006 (Thomson & Forman, 2009). This source provides cancer incidence rates per 100,000 people for White, Asian, Black, Chinese, and mixed races, which can be used to calculate ratios relative to a reference group. Data for prostate cancer in the U.S. come from the CDC'S WONDER Database on U.S. Cancer Statistics from 1999 to 2012 (CDC WONDER, 2012). For cancer incidence, the database for cancer incidence from 1999 to 2012 was used. Outputs were sorted by cancer sites, region, and race. ASRs were selected, and query factors were as follows: "all regions," "male only," "all ethnicities and races," and "all ages." Years selected were 2002 through 2006, inclusive. The cancer of interest was "male genital system: prostate." The 2000 U.S. standard was used for the ASRs. For cancer mortality, the database for cancer mortality from 1999 to 2012 was used. Outputs were sorted again by cancer sites, region, and race. ASRs were selected based on the 2000 U.S. standard population. All regions, ages, races, and ethnicities available were selected. Only males were selected, and the cancer of interest was prostate cancer of the male genital system for the year 2012. ResultsAccording to the 2012 mortality rates presented in Figure 1, the U.S. outperformed the U.K. in female breast cancer survival. The entire U.K. had an average mortality rate of 24.0 women per 100,000 people while the U.S. had an average mortality rate of only 22.2 women per 100,000. Even the best performing region of the U.K., Northern Ireland, has a higher mortality rate of 23.1 deaths per 100,000 than the rate of 22.8 deaths in the Midwest, which is the worst performing region of the U.S. According to the analysis of cancer incidence rates in both the U.K. and U.S. by race in Figure 2, diagnosis levels are similar for most racial minority groups. White women in both countries are significantly more likely than other racial groups to be diagnosed with breast cancer; the U.K. had a female breast cancer incidence of 123.7 per 100,000 people for White women, which is comparable to the 124.7 incidence rate in the U.S. The only major difference in the racial breakdown is for Black women, who had an incidence rate of 93.4 in the U.K. but a much higher incidence rate of 115.4 in the U.S. Therefore, for every 100 White women diagnosed in the U.S., approximately 93 Black women are diagnosed. In contrast, for every 100 White women diagnosed in the U.K, only 76 Black women are diagnosed. However, the actual mortality rates that are found in Table 1 for the U.S. and Table 2 for the U.K. reverse the incidence rate trend (Appendix). During the period from 2002 to 2006, one-year mortality rates in the U.K. showed a Black to White mortality ratio of 1.22, meaning that for every 100 White women who died of breast cancer in the U.K., approximately 122 Black women died as well. The three-year Black-to-White mortality ratio was slightly greater at 1.27. Despite this clear inequality of outcomes, Black women fare even worse in the U.S; the mortality ratio for Black women to White women was 1.38, reflecting the fact that approximately 138 Black women die from breast cancer for every 100 White women. The data in Figure 3 indicate that even though Black women are less likely to be diagnosed with breast cancer, they are more likely to die of the disease in both countries, particularly in the U.S.
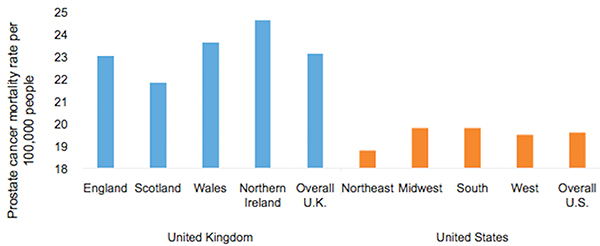
Figure 2. Age-standardized female breast cancer incidence ratios relative to White in-country reference group, which is highlighted by the black line, in the U.S. and U.K., 2002 to 2006. This trend is supported by the literature, which finds strong evidence that for Black women, annual incidence of breast cancer is lower but its mortality is higher (Williams & Jackson, 2005). While data from the U.K. are scarce, other research exploring the racial disparity in breast cancer mortality rates verifies this finding: Analyzing mortality rates by race between 1998 and 2003, inclusive, one study found a female breast cancer Black to White mortality ratio of 1.23 in the U.K, which is similar to the 1.27 ratio calculated from three-year survival data (Jack, Davies, & Møller, 2009). Over a similar period in the U.S., the Black to White mortality ratio was even higher at 1.35, as indicated by Table 1. The U.S. Black to White mortality ratio has risen over the past decade to 1.42 in 2012. When focus shifts to the male experience with prostate cancer, according to the 2012 mortality rates presented in Figure 4, the U.S. significantly outperforms the U.K. in survival rates. The U.K. had a mortality rate of 23.1 men per 100,000 people whereas the U.S. had a mortality rate of only 19.6 men per 100,000. For every 100 men in the U.K. who die of prostate cancer in a given year, only 85 U.S. men are expected to die. Despite the significantly higher prostate cancer mortality rates in the U.K., men in the U.S. are more likely to be diagnosed with prostate cancer than their counterparts in the U.K. Overall, 98.0 men per 100,000 are diagnosed with prostate cancer in the U.K, whereas a rate of 157.8 men are diagnosed in the U.S for a difference of 46.8%. As with breast cancer, even the U.K.'s best-performing region, Scotland, has a higher mortality rate of 21.8 deaths per 100,000 than the rate of the worst-performing regions of the U.S., the South and the Midwest, at 19.8 deaths per 100,000.
Figure 3. Age-standardized female breast cancer mortality ratios relative to White in-country reference group, which is highlighted by the black line, in the U.S. and U.K, 2002 to 2006. Even though Asian and other racial groups experience lower incidence rates than their White counterparts, Black citizens of both countries experience higher incidence rates of prostate cancer than White citizens. For instance, while diagnoses are significantly more frequent in the U.S., Black men are far more likely to be diagnosed in both countries than White men with an incidence rate of 202.5 per 100,000 in the U.K. and 238.7 in the U.S. (Figure 5). However, the relative incidence ratio of Black to White men in the U.K. is 2.08, while the relative incidence ratio is only 1.60 in the U.S. This suggests either that Black men in the U.S. are not getting prostate cancer at the same rate as their U.K. counterparts or that U.S. Black men are not getting diagnosed at a rate comparable to that of the U.K. Black men despite having the disease. In contrast, Asian men in both countries are less likely to be diagnosed than White men, with an incidence rate of 48.9 per 100,000 in the U.K. and 86.7 in the U.S. The Asian to White relative incidence ratio in the U.K, at 0.50, is close to the 0.58 relative incidence ratio observed in the U.S. (Figure 5). "The data in Figure 3 indicate that even though Black women are less likely to be diagnosed with breast cancer, they are more likely to die of the disease in both countries, particularly in the U.S."
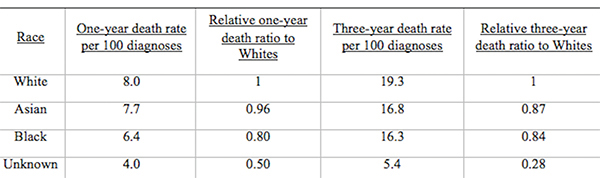
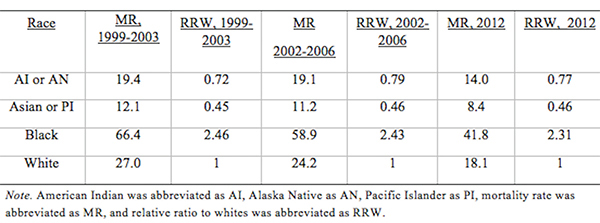
Figure 4. Age-standardized prostate cancer mortality rates per 100,000 people by country and region, 2012. The magnitude of these ratios change, however, when mortality data across the countries are compared in Figure 6. The relative mortality ratio for Black to White men in the U.K. at oneyear survival is 0.80, implying that for every 100 White men who die within the first year after diagnosis, only 80 Black men are expected to die. This occurs despite the fact that 208 U.K. Black men are expected to be diagnosed for every 100 White men as indicated in Table 3. This trend is confirmed by another study that found no significant difference in mortality rates between Black and White men for prostate cancer, with a relative Black to White mortality ratio of 0.93 despite higher incidence rates in Black men in the U.K. (Jack, Davies, & Møller, 2010). In contrast, the Black to White mortality ratio for the U.S. over the same period in Table 4 was 2.43, indicating that for every 100 White men who died of prostate cancer, approximately 243 Black men died as well. U.S. Black men are significantly more likely to die from prostate cancer than White men, which reverses the trend observed in the U.K. The trend does not extend to other racial minorities in the U.S. since both Asian and other racial groups experience mortality rates that are less than those experienced by White citizens.Continued on Next Page » From the Inquiries Journal Blog   Related ReadingJournalQuest is a free program to help academic student publications increase online readership and distribution. If you are interested in enrolling a journal at your school, please visit the JournalQuest website. Monthly Newsletter SignupThe newsletter highlights recent selections from the journal and useful tips from our blog. Suggested Reading from Inquiries Journal
Inquiries Journal provides undergraduate and graduate students around the world a platform for the wide dissemination of academic work over a range of core disciplines. Representing the work of students from hundreds of institutions around the globe, Inquiries Journal's large database of academic articles is completely free. Learn more | Blog | Submit Follow IJ
Latest in Health Science |