From Discussions VOL. 11 NO. 2Using Flow Cytometry and Quantitative Real-Time PCR to Investigate the Role of IL-1 in T-Cell Proliferation and HIV- 1 Reactivation
IN THIS ARTICLE
KEYWORDS
AbstractWith the advent of antiretroviral therapy, suppressing the HIV-1 virus and stopping the progression of the disease are now possible. Even with long-term antiretroviral therapy, HIV reservoirs remain in individuals. These individuals experience an increase in inflammatory cytokines such as IL-6 and IL-1β that results in the proliferation of CD4 T-cells. In this study, we explored the relationship between inflammatory cytokine-induced proliferation and reactivation. To assess this relationship, we investigated the role of a specific inflammatory cytokine, IL-1β. It was concluded from our experiments that CD4 T-cells are able to proliferate in the presence of IL-1β. Although IL-1β may not induce overt reactivation of HIV-1, as shown in the flow cytometry data, further studies need to be conducted to see whether or not IL-1β propagates the reservoir. IntroductionThe single-stranded RNA virus human immunodeficiency irus-1 (HIV-1) presents a major public health crisis worldwide. Approximately 1.1 million people in the United States currently live with HIV, but only four out of five people realize that they are infected with the virus (Hall et al., 2008). The HIV-1 RNA and the reverse transcriptase enzyme , which synthesizes a complementary DNA strand is from this viral RNA, are contained within the nucleocapsid shell of the virus. This shell is encapsulated within a lipid bilayer that incorporates an integral membrane glycoprotein (gp41) and an associated glycoprotein (gp120). Associated glycoprotein molecules bind to CD4 molecules on the surface of helper T-cells. This interaction allows gp120 to insert its amino-terminal head into the host-cell membrane, causing the viral and T-cell membranes to fuse, which releases the viral core into the cytosol. Ultimately, the viral RNA can become DNA that is integrated into the host chromosome, which may kill the T-cell. The latent reservoir is a pool of cells that contain viral DNA but do not make active viruses (Berg et al., 2010). Therefore, HIV-1 results in decreased levels of the CD4 T-cell population. CD4 T-cells help individuals fight infections. Decrease in CD4 T-cells due to HIV is associated with chronic inflammation and acquired immunodeficiency syndrome (AIDS). Due to its high mutation rate, the error-prone replication of HIV presents an ever-changing array of coat proteins, making it difficult to develop an effective vaccine. HIVinfected individuals are commonly treated with highly active antiretroviral therapy (ART) that utilizes a combination of several antiretroviral drugs. With ART, individuals typically experience an increase in CD4 T-cell-counts and an improvement in immune function. ART can reduce plasma HIV-1 RNA levels below the detection threshold of clinical assays, which is usually 50 copies/mL (Doyle et al., 2012). Due to this decrease in RNA level, previous studies have predicted that 2.3 to 3.1 years of ART could potentially cure HIV-1 infection (Perelson et al., 1997). However, recent studies have shown that complete eradication of HIV is impossible even after two to three years of ART. For example, the “Mississippi baby,” whose mother was HIV-1 positive, started ART within hours of birth. Although the child had undetectable levels of viral matter after a prolonged withdrawal from treatment and was thought to be cured of HIV, her virus still demonstrated reactivation after treatment was stopped (Stover et al., 2014). Similarly, although viral loads may appear low due to successful ART, patients experience an increase in inflammatory cytokines such as IL-6 and IL-1β. This, in turn, results in the proliferation of CD4 T-cells, a major site of latent virus reservoir (Shive et al., 2014).. When HIV reactivates upon removal of treatment, CD4 T-cells proliferate and produce more viral proteins. Therefore, HIV-1-infected individuals currently require lifelong ART to prevent a small but longstanding HIV latent reservoir from infecting more cells (Bosque et al., 2011). The aim of this study is to assess whether proliferation induced by 1L-1β is associated with reactivation. 1L-1β, or catabolin, is a cytokine that induces various inflammatory and immune responses. Compared to uninfected subjects, untreated HIV-1-infected patients express increased levels of 1L-1β within all anatomical sites of the lymph nodes, especially in medullary cords, sinuses, and the T-cell zone (Shive et al., 2014). Patients who receive ART also express some level of 1L-1β (Shive et al., 2014). To assess the relationship between 1L-1β-induced proliferation and reactivation, we used flow cytometry and real-time polymerase chain reaction (PCR). Flow cytometry was used to measure the relative percentages of viral reactivation and proliferation, and to distinguish cells that divided after stimulation with 1L-1β from those that did not. A Carboxylfluorescein succinimidyl ester (CFSE) dilution was performed to assess the rate of proliferation of cells stimulated with IL-1β. In addition, real-time PCR was used to quantify viral RNA levels in the supernatant that was released from the cells.
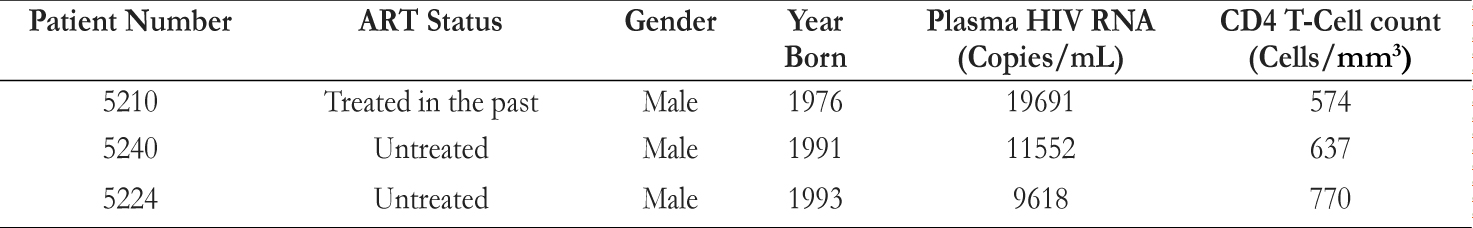
Table 1. Clinical characteristics of 3 Human Immunodeficiency Virus (HIV)-Infected Subjects Examined in this Study. ART indicates antiretroviral therapy. All three subjects are HIV-infected, viremic patients. Materials and MethodsEthics StatementAll participants in this study willingly provided written informed consent and fully understood the purpose and methods of this project. Patient studies were covered under the University Hospitals and Case Medical Center Institutional Review Board. Data analyses were conducted using an anonymous database. Peripheral Blood Mononuclear Cell [PBMC] Purification from Whole BloodBlood samples from three viremic patients were collected. Patient characteristics are shown in Table 1. Two samples of blood were rinsed with phosphate-buffered saline (PBS)., and the mixture was then added to the blood in 50mL Falcon tube. The mixture of blood and PBS was then slowly overlaid at a 45-degree angle onto a Ficoll-Hypaque solution (GE Healthcare) Once all the mixture was overlaid on the Ficoll- Hypaque, the Falcon tube was spun down in a centrifuge at 1800 rpm (680g) for 30 minutes. After separation on a Ficoll gradient, the middle buffy coat layer was collected. The volume of the cells was diluted with PBS, and then the cells were spun down once again in a centrifuge at 1200 rpm (300g) for 10 minutes. The supernatant was then decanted, and the cells were rewashed with PBS and spun down. 10mL PBS was added for counting by hemocytometer. The cells were then resuspended at the appropriate volume and concentration required for testing. Human Serum (HS), Fetal Bovine Serum (FBS) and Cytokine TreatmentAfter purifying cells by centrifugation over Ficoll, cells were labeled with CFSE dye (Molecular Probes Invitrogen), and quenched afterwards with FBS on ice. The cells were then cultured in a Roswell Park Memorial Institute (RPMI) 1640 medium supplemented with 1% penicillin/streptomycin (Gibco), 1% L-glutamine (Gibco), 1% sodium pyruvate (Gibco), and either 10% fetal bovine serum (FBS; Gemini Bioproducts) or 10% human serum (HS; Gemini Bio-products). A sample of cells, plated in a well plate, was stimulated with either recombinant human IL-1β (R&D Systems) or phytohaemagglutinin (PHA, Sigma-Aldrich). The cells were incubated for 7 and 12 days at 37°C and 5% CO2. Harvest and Staining for Flow CytometryAfter 7 or 12 days, the plate was removed from the incubator. The bottom of each well was scratched to dislodge adherent cells and then placed into a flow tube. The flow tube was spun for 3 minutes, and supernatant was saved for later use (i.e. real-time PCR). After spinning, PBS and Live/Dead- Yellow (Molecular Probes) dye were added into each tube and the tubes were incubated in the dark for 20 minutes at room temperature. T-cell phenotypes were quantified using the following flourochrome-conjugated monoclonal antibodies: CD4-BV421 (Clone: RPA-T4; BD Biosciences), CD8-PerCP-Cy5.5 (Clone: RPA-T8; BD Biosciences), and CD3-allyphycocyanin (APC)-eFluor780 (Clone: SK7; eBioscience). Each sample was stained with antibody staining cocktail for 20 minutes at room temperature in the dark. Afterwards, the cells were spun, washed, and fixed in PBSparaformaldehyde solution. To detect intracellular p24, the cells were washed and permeabilzed with a saponinbased buffer (BD Biosciences) and incubated with p24-PE antibody (Clone: KC57-RD1, Coulter Clone) for 40 minutes on ice. Cells were acquired on an LSRII flow cytometer (BD Biosciences) using BD FACSDiva software (version 6.2, BD Biosciences), and analyzed using FlowJo software (version 8.8.7, TreeStar). RNA IsolationA sample of supernatant from PBMCs stimulated with IL-1β or PHA was mixed with buffer AVL and a carrier RNA mix from RNeasy® Mini Kit (Qiagen). The mixture was incubated for at room temperature, and 100% ethanol was added. The mixture was then placed into a spin column from the mini kit, and spun down at 8000rpm (6800g) for one minute. The flow-through was discarded, and another sample of the mixture was spun down. Then buffer AW1 with ethanol was added, spun down at 8000rpm for one minute, and the flow-through was discarded. Buffer AW2 was added, the column was again spun down at 14000rpm (20800g) for 3 minutes, and the flow-through was discarded. The spin column was placed into an Eppendorf tube, followed by the addition of buffer AVE. The tube was incubated for at room temperature. Finally, the tube was spun down at 8000rpm for one minute and the elution was stored for complementary DNA (cDNA) synthesis. cDNA SynthesiscDNA was synthesized from reverse transcriptase with High-Capacity RNA-to-cDNA kit (Applied Biosystems, Grand Island, NY). A small sample of RNA from Qiagen kit RNA Isolation was added to HIV-1 reverse Gag primer (5’GTTCTTGCTATTGTCACTTCC-3’). The mixture was incubated in a thermal cycler. A mixture containing first strand buffer, 0.1M DTT, 10mM dNTPs, and RNase-free water was added. The new mixture was once again incubated in the thermal cycler. Then, a mixture containing Moloney Murine Leukemia Virus Reverse Transcriptase (M-MLV RT) and RNase-free water was added, followed by prolonged incubation in the thermal cycler. RNA Measurement by Real-Time Quantitative Polymerase Chain Reaction (PCR)A sample of cDNA was amplified using the StepOnePlus real-time quantitative PCR (Applied Biosystems). The cDNA sample was mixed with TaqMan Fast Universal PCR Master Mix, forward primer (5’-CCAGATCTGAGCCTGGGAGCTCTC-3’), reverse primer (5’-CTGTTCGGGCGCCACTGCAG-3’), and RNase-free water. The mixture was incubated in the thermal cycler. Pre-amplified products were subjected to a nested realtime PCR. In a new PCR plate, a sample of the mixture from the previous step was added in duplicates to a mixture containing Taqman Fast Universal PCR Master Mix, forward primer(5’ - T T A A G C C T C A A T A A A G C T T G C C -3’), reverse primer (5’ - G T T C G G G C G C C A C T G C T A G A - 3’), and U5 probe (5’ - 6FAM - C C A G A G T C A C A C A A C A G A C G G G C A C A -MGBNFQ- 3’). 6FAM indicates 6-carboxy fluorescein and Q indicates a 6-carboxytetramethylrhodamine group quencher conjugated though a linker arm nucleotide.
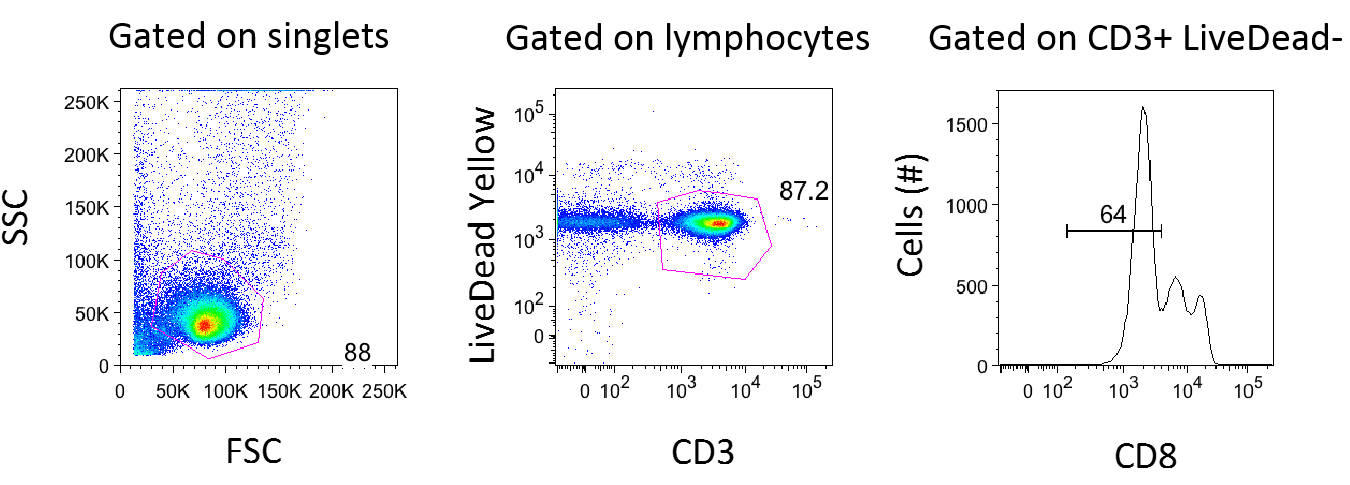
Figure 1. Gating Strategy for Flow Cytometry Analysis. Data for Media in FBS for Patient 5210 (Day 7) was analyzed using FlowJo Version 8.8.7. After gating on singlets, lymphocytes were gated using forward and side scatter. The forward scatter (FSC) measures the alterations of cell size whereas the side scatter (SSC) measures cell granularity. Live CD3+ T-cells were defined on a plot of CD3 vs. Live/Dead Yellow stain (b). CD8 negative T-cells were gated because reactivation causes downregulation of the CD4 molecule. ResultsGating Strategies for Flow Cytometry AnalysisAs shown in Figure 1, cells were first gated for singlets to exclude cell aggregates (forward scatter area vs. forward scatter height, not shown) and then lymphocytes (side scatter vs. forward scatter shown in Figure 1a). The lymphocytes gate was further analyzed for its uptake of the Live/Dead-Yellow viability dye in order to determine live versus dead cells and their expression of CD3 (LiveDead Yellow vs. CD3 shown in Figure 1b). The live, healthy T -cell population (CD3 positive) was gated and dead cells were excluded. T-cells that lacked CD8 expression were used for further analysis (Figure 1). Comparing HS and FBSPrevious studies suggested that in vitro studies about HIV-1 are usually performed in human cell cultures supplemented with FBS due to efficient proliferation (Perdomo et al., 2012), It was expected that 1L-1β would induce better proliferation in FBS than in HS. It was also expected that this would allow a second level of analysis to determine the relationship between proliferation and reactivation. When PBMCs treated with polyhydroxyalkanoates (PHA) were supplemented with HS, however, more cells reactivated, as shown in Figure 2. In addition, both of the cells that proliferated and those that did not reactivated The data suggests proliferation and reactivation are uncoupled from each other. It also suggests there is an additional factor with human serum that induces reactivation. The assay was not particularly sensitive because there was not a significant release of virus when PBMCs were left in the presence of 1L-1β, as measured by Gag protein expression. Inflammatory cytokine IL-1β induces CD4 T-Cell proliferationIt was observed that cells stimulated by the inflammatory cytokine 1L-1β proliferated. Three PBMC samples were prepared from two viremic patients who received no ART and one viremic patient who had received ART in the past but was no longer on therapy (Table 1). Viremic patients were used for this study since the measurement of reactivating virus was expected to be more feasible givent their high viral loads. To track cell division, the cells were labeled with carboxyfluorescein succinimidyl ester (CFSE) dye and stimulated with 1L-1β or PHA for 7 days. CFSE dye allows for a direct measurement of cells undergoing division, since each cellular division dilutes the dye. As shown in Figure 2, 1L-1β induced cell division in both FBS and in HS. PHA induced the highest level of cell division, and media alone induced the lowest level of cell division. In all three cases, cells divided at a higher rate when they were subjected to FBS than HS. Inflammatory cytokine IL-1β Downregulates CD4 T-CellsAs shown in Figure 1c, CD8-negative T-cells were gated because when cells are reactivated and express Gag protein, expressions of the CD4 molecules on the surface undergo downregulation. The expression of Gag protein was measured by its particular epitope, p24Gag. Examination of the cells that were p24Gag positive and CD4 negative, allowed for the conclusion that the virus was reactivated.
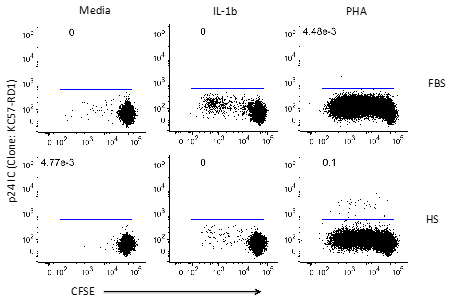
Figure 2. IL-1β Induces Cell Proliferation. Peripheral blood mononuclear cells (PBMCs) from representative patient 5210 (Viral load: 19691 copies/mL) were (1) left in the absence of cytokines (media) or in the presence of IL-1β or PHA, and (2) cultured in a medium supplemented with FBS or HS for 7 days. The cells were stained with 5,6-carboxyfluorescein-diacetate succinimidyl ester (CFSE) dye to track cell divisions. The cells were then assessed for intracellular p24Gag expression by flow cytometry. Numbers indicate percentages of the CD8-negative CD3-positive T-cell population.
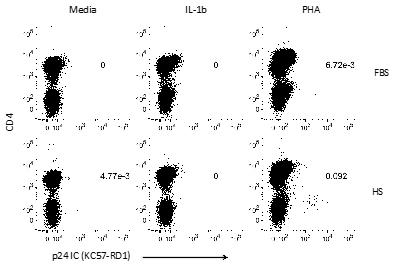
Figure 3. Reactivation causes downregulation of CD4. In representative patient 5210 (Viral load: 19691 copies/mL), virus in CD4 positive T-cells caused downregulation when it was reactivated. IL-1β did not induce reactivation when supplemented with FBS or HS. IL-1β Does Not Cause Overt Reactivation of the Viral ReservoirPBMCs were incubated for 7 days in the presence of IL-1β or PHA and the proliferated cells were examined for latent virus by assessing intracellular p24Gag by flow cytometry. Positive p24Gag indicates the presence of live virus that can make viral proteins. Each panel in Figure 2 and 3 shows the percentage of p24Gag-positive T-cells from the parent population. In representative patient 5210 (viral load: 19691 copies/mL), IL-1β caused proliferation without robust viral reactivation. In both FBS and HS treatment, zero percent of cells of the parent population were p24Gag-positive when stimulated with IL-1β. In media, zero percent of cells reactivated in FBS and 0.00477 percent of cells were reactivated in HS. PHA, a positive control, induced T-cell activation in a robust manner. When HS was present, 0.00448 percent of cells were reactivated, as shown in Figure 2, and 0.00672 percent of cells were reactivated, as shown in Figure 3. PHA supplemented with HS induced the highest level of reactivation. Under this condition, 0.1 percent of the parent population reactivated (Figure 2) and 0.092 percent demonstrated reactivation (Figure 3). This was due to the low number of infected cells. Real-time PCR was used to quantify the amount of viral RNA that would be released in the culture supernatants. Representative standard curves and sample data are shown in Figures 4a and 4b, respectively. When the target sequence was amplified, IL-1β led to a very low but detectable level of viral RNA in the supernatants. Although IL-1β did not induce viral reactivation as measured by flow cytometry, viral RNA levels increased in Real-time PCR to about five-fold in the presence of FBS and eight-fold in the presence of HS (Figure 4c). The results indicate that IL-1β can potentially lead to viral expression from latently infected cells, even in the absence of detectable Gag expression. As expected, PHA in the presence of HS resulted in the greatest amount of viral RNA. Interestingly, when viral RNA levels were measured in copies/mL, a substantial amount of viral RNA was detected even in the negative control (Figure 4c). The presence of the viral RNA could be due to the amplification steps in which a small amount of RNA was amplified during the real-time PCR, or because viremic samples were used in this study. Samples from HIV-positive individuals who are not viremic may have lower baseline HIV RNA levels. In addition, the number of RNA copies was generally lower after 12 days of treatment, as shown in Figure 4c. Other cells may have stopped the virus, cells themselves may have died so that fewer cells were replicating the virus, or cells that reactivated may have become transient.Continued on Next Page » From the Inquiries Journal Blog  ") Related ReadingJournalQuest is a free program to help academic student publications increase online readership and distribution. If you are interested in enrolling a journal at your school, please visit the JournalQuest website. Monthly Newsletter SignupThe newsletter highlights recent selections from the journal and useful tips from our blog. Suggested Reading from Inquiries Journal
Inquiries Journal provides undergraduate and graduate students around the world a platform for the wide dissemination of academic work over a range of core disciplines. Representing the work of students from hundreds of institutions around the globe, Inquiries Journal's large database of academic articles is completely free. Learn more | Blog | Submit Follow IJ
Latest in Biology |