Spatial Analysis of Inflammatory Bowel Disease in South Carolina
By
2015, Vol. 7 No. 10 | pg. 1/1
IN THIS ARTICLE
KEYWORDS
Crohn’s disease (CD) and Ulcerative Colitis (UC) are both parts of the inflammatory bowel disease (IBD) family and are lifelong disorders of the gastrointestinal tract. Both diseases are very similar in their clinical symptoms, which consists of bloody diarrhea, rectal urgency and abdominal pain. While UC and CD appear very similar, UC is limited to the colon and rectum while CD may be found anywhere in the Gastrointestinal (GI) tract. The etiology of IBD has yet to be definitively established. The most popular theory is the ‘Hygiene Hypothesis’ which points to a decrease of infections during adolescence leading to an increase of autoimmune diseases later in life, such as IBD(Okada, Kugn, Feillet, & Bach, 2010). While it is widely accepted that this may play an essential role in the development of IBD, many believe that it is but a small piece in the web of causation. A more comprehensive explanation may be a combination of an individual being genetically susceptible to the disease along with being exposed to an array of certain environmental factors leading to the disruption of the gut microbiome and ultimately bringing about the onset of IBD(Ananthakrishnan, 2013). Both CD and UC share many similar risk factors such as high socioeconomic status, living in an urban environment, education, and being of Jewish ethnicity(Green, Elliott, Beaudoin, & Bernstein, 2006). UC and CD do however differ with a few factors such as smoking status(Bridger, Lee, Biarnason, Lennard Jones, & Macpherson, 2002) and past appendectomy(Andersson, Olaison, Tysk, & Ekbom, 2003). Previous studies in Europe (Aamodt, et al., 2008; Nerich, et al., 2006) and the USA (Kappelman, et al., 2007; Sonnenberg, McCarty, & Jacobsen, 1991) have shown that IBD, including both UC and CD, follows a north-to-south gradient with more cases being found in the north than in the south.The purpose of this study is to investigate the distribution of the burden of UC, CD, and IBD on each of the 46 counties in South Carolina. Specifically, we wish to examine if there is spatial clustering of any of these diseases, and if so, where the clustering exists. MethodsIn order to estimate the burden of IBD in each South Carolina county, in-patient data from ICD-9 codes were ascertained from the SC Revenue and Fiscal Affairs Office for the years 2005 through 2012. Each of the diseases, UC, CD, and the combination of the two to form IBD were divided by the estimated population in each county and multiplied by 100,000 for each of the eight years included in the study. It should be noted that this calculated value did not give us an estimate of the incidence or prevalence of the diseases but merely an estimate of the burden of each of the diseases. By using Arc GIS software, this burden estimation was then displayed on separate choropleth maps for each of the years and disease subtypes. We then assessed the data for spatial autocorrelation by using the Local Moran’s I test using row standardization and a significance level of 0.05. ResultsFrom the years 2005 to 2012 we saw a general increase in the crude number of people being admitted to the hospital for UC, CD and IBD (Table 1). In regards to our calculated burden per 100,000 population categories, each of the three diseases appeared to decline for the first few years followed by a general increase. For each of the years, CD had roughly two times the amount of crude hospitalizations than UC. Also, relative CD cases increased at nearly double the rate of UC, 33.73% compared to 16.59%, respectively.
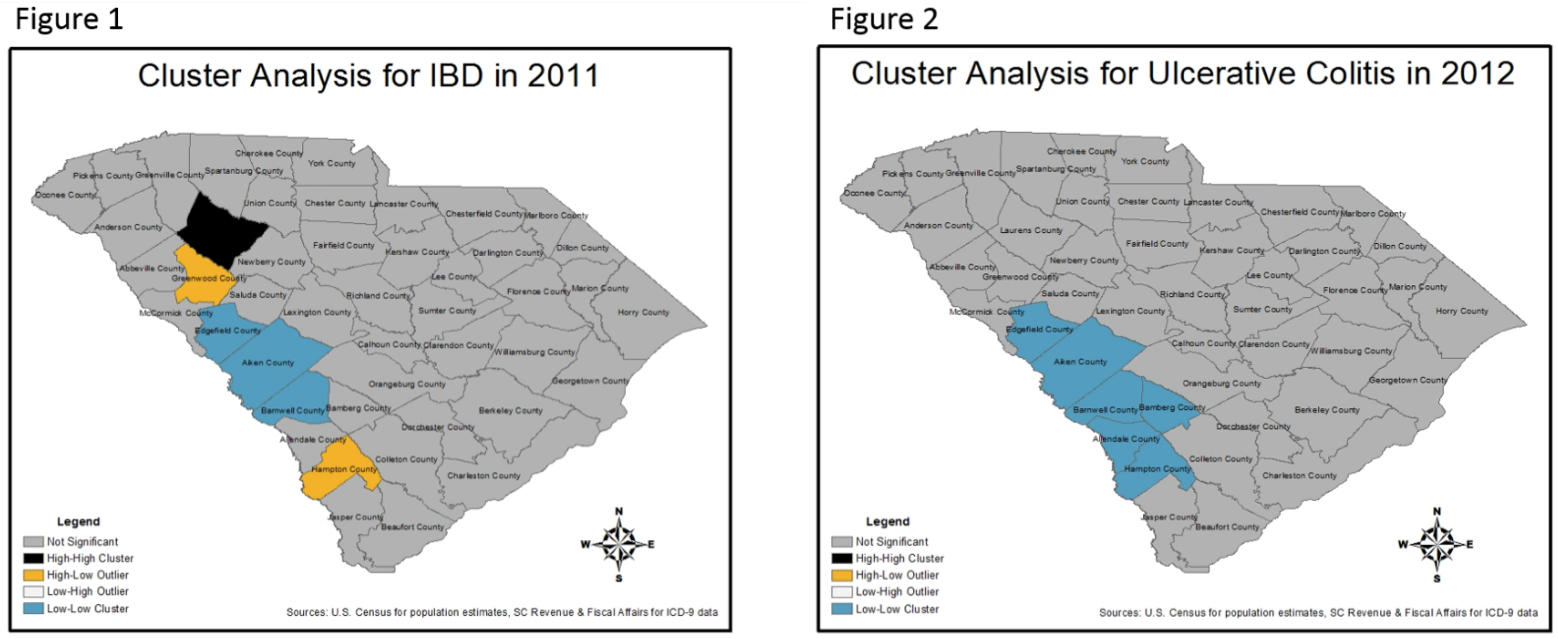
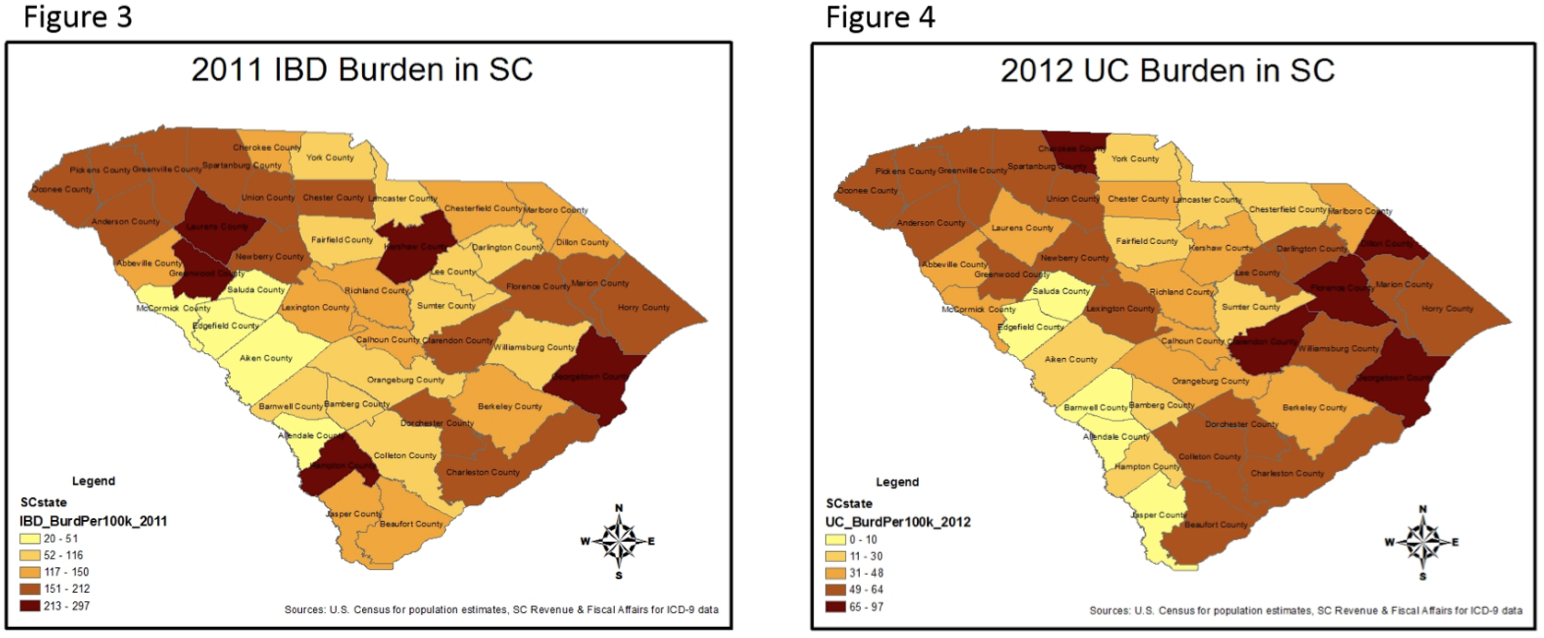
The results of the Local Moran’s I test results are separated into five categories; not significant, High-High cluster where a county with high values is adjacent to counties also with high values, Low-Low cluster where a county with low values is adjacent to counties also with low values, High-Low outlier where a county with high values is near counties with low values, and Low-High outlier where a county with low values is near counties also with low values. In general, the results tended to show more clustering and outliers towards the later part of the study, specifically in 2011 and 2012 (Table 2). Every year, with each of the three diseases, the majority of counties did not experience significant clustering or outliers, but for one year, 2006, UC did not experience any clustering or outliers. The resulting maps of the Local Moran’s I test for IBD in 2011 (Figure 1) and for UC in 2012 (Figure 2) coupled with the corresponding choropleth maps for the same years (Figures 3 & 4), using five natural break classifications, are clear visual representations of the clustering experienced by our data.
DiscussionIn our study we found significant clustering and outliers of UC, CD and IBD hospitalizations across SC in most of the years included. To the best of our knowledge, this is the first study to investigate the geographic variations of IBD in SC. While more large-scale studies have demonstrated that these diseases tend to experience spatial clustering, this study focused on a relatively small area with a diverse population. It would be difficult to say that our results strengthen the north-south gradient that IBD has previously been shown to follow. But our results do indicate more clustering around the more urban centers of SC including: Charleston, Richland and Greenville counties. Although, more research in needed in order to test the significance and confirm these results. A strength of this study was the use of a previously validated spatial analysis method, Local Moran’s I, that not only indicated spatial clustering but specifically pointed to the areas where clustering occurred. This information may enable future researchers to examine potential environmental factors that may be influencing the progression of these diseases across SC. Along with the strengths, there were also a few limitations of our study, the first of which was the use of aggregate level data. This limitation restricted our ability to control for multiple hospital stays by the same individual, thus making us unable to estimate disease incidence or prevalence in each county. Although, with IBD being a relatively rare disease, our ability to accurately estimate disease occurrence at the county level would be very difficult due to the small number of cases in each county. The second limitation is the use of in-patient ICD-9 data where we only captured those individuals who had severe enough of symptoms to be hospitalized. By missing out on those individuals who were either sent home the same day or those who only had mild symptoms and did not go to the hospital, our results are potentially biased. Although, this limitation may, in part, explain the near two-fold increase in hospitalizations due to CD when compared to UC. Also, since we modeled the hospitalizations instead of the incidence rates, we may have the ability to assess the temporal severity of these diseases, and examine the potential association with other environmental factors. The third, and final, limitation of this study was the lack of ability to control for potential confounders. While using aggregate level data, we were unable to adjust for potential confounders such as: age, sex, ethnicity, smoking status, income or education. But, with this being more of an ecological study design, serving as a pilot exploratory research project, it was merely a building block for a more comprehensive study in the future. With the results of this study, we now plan to conduct a similar study, but on the individual instead of aggregate level. We hope to be able to geocode the residential addresses of those inflicted with IBD across SC and explore more potential environmental factors that may be impacting the course of these diseases. ReferencesAamodt, G., Jahnsen, J., Bengtson, M.-B., Moum, B., Vatn, M. H., & Group, I. S. (2008). Geographic Distribution and Ecological Studies of Inflammatory Bowel Disease in Southeastern Norwar in 1990-1993. Inflammatory Bowel Disease, 14(7), 984-991. Ananthakrishnan, A. N. (2013, June). Environmental Risk Factors for Inflammatory Bowel Disease. Journal of Gastroenterology & Hepatology, 9(6), 367-374. Andersson, R. E., Olaison, G., Tysk, C., & Ekbom, A. (2003). Appendectomy is Followed by Increased Risk of Crohn's Disease. Gastroenterology, 124(1), 40-46. Bridger, S., Lee, J. C., Biarnason, I., Lennard Jones, J. E., & Macpherson, A. J. (2002). In siblings with similar genetic susceptibility for inflammatory bowel disease, smokers tend to develop Crohn's disease and non-smokers develop ulcerative colitis. Gut, 51, 21-25. Green, C., Elliott, L., Beaudoin, C., & Bernstein, C. N. (2006). A Population-based Ecologic Study of Inflammatory Bowel Disease: Searching for Etiologic Clues. American Journal of Epidemiology, 164(7), 615-623. Kappelman, M. D., Rifas-Shiman, S. L., Kleinman, K., Ollendorf, D., Bousvaros, A., Grand, R. J., & Finkelstein, J. A. (2007). The Prevalence and Geographic Distribution of Crohn's Disease and Ulcerative Colitis in the United States. Clinical Gastroenterology and Hepatology, 5(12), 1424-1429. Nerich, V., Monnet, E., Etienne, A., Louafi, S., Ramée, C., Rican, S., . . . Carbonnel, F. (2006). Geographic Variations of Inflammatory Bowel Disease in France: A Study Based on National Health Insurance Data. Inflammatory Bowel Disease, 12(3), 218-226. Okada, H., Kugn, C., Feillet, H., & Bach, J.-F. (2010). The 'hygiene hypothesis' for autoimmune and allergic diseases: an update. The Journal of Translational Immunology, 160, 1-9. Sonnenberg, A., McCarty, D. J., & Jacobsen, S. J. (1991). Geographic Variation of Inflammatory Bowel Disease Within the United States. Gastroenterology, 100(1), 143-149. 
From the Inquiries Journal Blog ")  Monthly Newsletter SignupThe newsletter highlights recent selections from the journal and useful tips from our blog. Suggested Reading from Inquiries Journal
Inquiries Journal provides undergraduate and graduate students around the world a platform for the wide dissemination of academic work over a range of core disciplines. Representing the work of students from hundreds of institutions around the globe, Inquiries Journal's large database of academic articles is completely free. Learn more | Blog | Submit Follow IJ
Latest in Health Science | ||||||||||||||||||||||||||||||||||||||||||||||||||||||||||||||||||||||||||||||||||||||||||||||||||||||||||||||||||||||||||||||||||||