Soil Pollution From Recycling Centers: Case Study Analysis from the Campus of Michigan State UniversityMaterials and MethodsThis study was conducted using soil samples taken from three different areas on Michigan State University’s campus. The first location was the MSU recycling center, which is located just south of Service Road and just west of Farm Lane, in the southern part of campus. We were primarily interested in the soil immediately around the dropboxes and the perimeter of the recycling center itself. The construction of the recycling center was completed in 2008, so while there is grass on this plot, there are no trees, which made sampling easier. The second location, Baker woodlot, is directly across Farm Lane from the recycling center and is estimated to be 31.5 hectares (“History of Baker Woodlot”). The central portion and periphery closest to the recycling center were used in control and experimental sample collection, respectively. Our third location was the Sanford Natural Area, from which we collected the other half of our control samples. The Sanford Natural Area is located in the northeast portion of campus, between Hagadorn Road and Bogue Street. There are four dorm buildings just to the south of the Natural Area, and the Red Cedar River creates the northern border. Sanford is approximately 13.8 hectares (“Sanford Natural Area”). Both Baker and Sanford have been preserved in their natural state since their purchase in 1855, when Michigan State College was founded (“History of Baker Woodlot”). The independent variable in this study was the distance, in meters, of our soil samples from the recycling center dropboxes. We also recorded distance from the edge of the woodlot for those samples taken from within Baker. Using a soil analysis kit, we measured the pH, phosphorus, potassium, nitrate, nitrite, ammonia, aluminum, and iron content of each of our samples as dependent variables. These particular variables were selected because the resources needed to test for them were readily available and because we wanted to broaden our analysis as much as possible by measuring a large number of variables. To conduct this experiment, soil samples were taken at distances of zero, ten, twenty, and thirty meters from the western boundary of Baker Woodlot—the border closest to the recycling center—with three replicates taken at each distance to enhance accuracy. First, we measured the desired distance from the western boundary of Baker. Then, to ensure randomization of site selection, a random number chart was used to determine how many steps to walk south before taking a sample. This process was for each replicate and was repeated for each distance. In this way, we avoided potential biases in site selection. Near the recycling center, three samples were taken at zero meters. The locations of each of these samples were also randomly selected, this time using a random number chart for number of steps north, east, and south. Finally, a third set of three samples was taken from around the perimeter of the recycling center, at a distance of 30 meters; a random number chart was used as previously described . The samples from these three locations comprised our experimental data. Three soil cores from the Sanford Natural Area and three more from Baker woodlot acted as our controls. Each of our control samples was taken from the central portions of the natural areas. Considering the sizes of each of these lots, and the natural state in which they have been preserved over the past 66 years, we are confident that our control samples accurately represent baseline levels of each of our dependent variables. We used surface soil for each of our samples because research indicates that it is more likely to reflect anthropogenic change (Papastergios et al., 2010). For the purposes of this study, we have defined surface soil as the top 10 centimeters of soil. Samples were taken at various times throughout the day based on the experimenters’ availability so temporal sampling was not controlled.Upon the completion of the sampling process—and with access to a soil handbook—we utilized a soil analysis kit to quantify each of the dependent variables previously listed. We conducted a number of correlation tests to determine if there are any linear relationships between variables—nutrient level (continuous) and distance from the dropboxes, or edge of woodlot (continuous). First, mean values were determined for each of the dependent variables taken from around the dropboxes. The same calculations were done on the three randomized samples taken from the recycling center’s perimeter. Secondly, we calculated average values for each of the measured variables at each distance within Baker. Thirdly, we constructed graphs for each element to illustrate the relationship between elemental content and distance from the dropboxes. All of our experimental data was compared to that of our control samples—which were also averaged to provide a mean value for each Sanford and Baker—to identify any changes from what we have defined as baseline levels in soil composition. ResultsThe exact level of each chemical measured for each soil sample, at each area can be seen in Appendix I. Appendix II contains the tables corresponding to the elements for which we did not attain readings at all locations. The averages of both control samples (Table 1), and the averages at each location (Table 2) were found for each chemical tested. Table 1: Mean Values of Control Samples (With Standard Deviation)
Table 2: Mean Values with Distance From Dropboxes (With Standard Deviation)
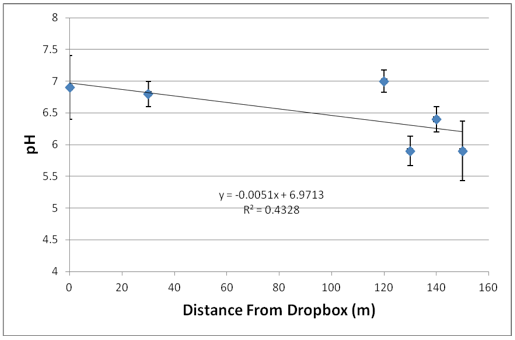
The first factor tested in each area was pH, from the measured distances of 0 m to 150 m, with a range from 5.9 to 7.0 (Table 2). Overall the general trend was a decreasing value as the distance from the drop box increased. The mean pH over all the distances was 6.5. This was illustrated on a scatter plot, and found to have a correlation coefficient of -0.658 (Figure 1). In the control samples at Sanford and Baker woodlot, the pH was found to have a mean 6.4 and 5.3, respectively (Table 1). Figure 1 — pH was measured at varying distances from the recycling drop boxes. This figure shows the averages of three samples at each sampling site. The pH steadily declined as the distance increased. Correlation coefficient: r = -0.5463. Using linear regression, p=0.01899. Error bars are based on standard deviation.
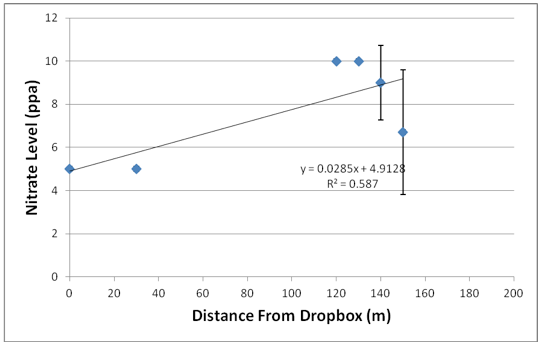
When nitrate was tested for the measured distances of 0 m to 150 m the value ranged from 5 ppa to 10 ppa (pounds per acre). Nitrate stayed constant at 5 ppa from 0 m to 30 m, after that it jumped up to 10 ppa at 120 m and showed a slight downward trend at distances of 120 m and 150 m. The mean of nitrate was found to be 7.6 (Table 2). This was plotted on a graph and found to have a correlation coefficient of 0.766 (Figure 2). In the control samples nitrate was found to have a mean of 6.7 ppa (Table 1). Figure 2 — Nitrate Level (ppa) vs. Distance From Dropbox (m): Nitrate was measured at varying distances from the recycling drop boxes. This figure shows the average of three samples at each sampling site. Except for the last couple points, the nitrate increases as distance increases. Correlation coefficient: r = 0.766. Error bars are based on standard deviation.
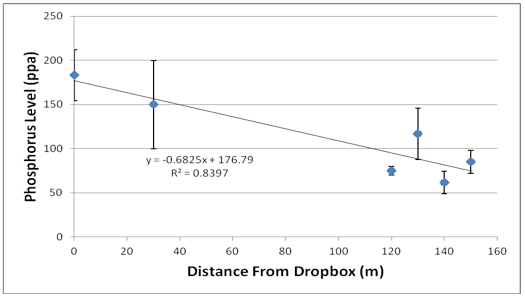
Phosphorus was the next chemical tested for all the soil samples. From 0 m to 150 m, the range of phosphorus measured was 61.7 ppa to 183.3 ppa. Overall, the phosphorus level decreased as distance increased. From 0 m to 30 m, it decreased, but once hitting the 120 meter mark, it significantly decreased, going from 150 ppa to 75 ppa (Table 2). After the 120 meter mark it rose to 116.7ppa at 130 meters and continued to level off from there (at 140 m 61.7 ppa, at 150 m 85 ppa). The average for phosphorus was 112 (Table 2). When graphed, a strong correlation coefficient of -0.916 was evident (Figure 3). In the control samples the mean found for phosphorus was 141.7 with a standard deviation of 11.8 (Table 1). Figure 3 — Phosphorus (ppa) vs. Distance From Dropbox (m): Phosphorus was measured at varying distances from the drop boxes. Figure 3 shows the average of three samples at each sampling site. The graph shows a strong negative correlation (-.916) between phosphorus level and distance. Error bars are based on standard deviation.
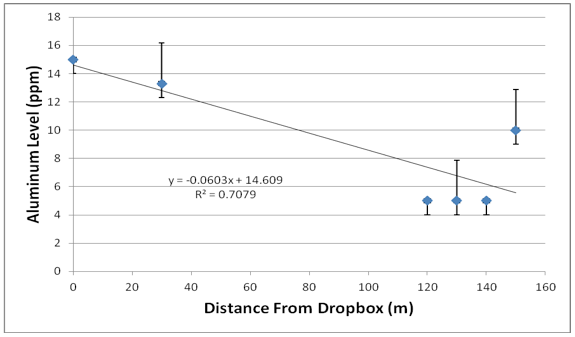
Aluminum was also negatively correlated with distance and the correlation coefficient was -0.841. The average Aluminum level at all sites was 8.9 ppm (Figure 4). Figure 4 — Aluminum (ppm) vs. Distance From Dropbox (m): Aluminum was tested at each site, and the averages of three samples were plotted vs. distance. The graph shows a strong negative correlation (-.841). p=1.15x10⁻⁵. Error bars are based on standard deviation. 
From the Inquiries Journal Blog   Monthly Newsletter SignupThe newsletter highlights recent selections from the journal and useful tips from our blog. Suggested Reading from Inquiries Journal
Inquiries Journal provides undergraduate and graduate students around the world a platform for the wide dissemination of academic work over a range of core disciplines. Representing the work of students from hundreds of institutions around the globe, Inquiries Journal's large database of academic articles is completely free. Learn more | Blog | Submit Follow IJ
Latest in Environmental Studies |