From Discussions VOL. 11 NO. 1Phase Cancellation in Ultrasonic Measurements Due to Misalignment of Receiving Transducer
By
Discussions 2015, Vol. 11 No. 1 | pg. 1/1
IN THIS ARTICLE
KEYWORDS
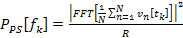
Bone sonometry is an established modality for the characterization of potentially osteoporotic cancellous bone. The ultrasonic field propagated through the heel bone (calcaneus) is subject to diffraction effects that complicate the acquired data. The immediate goal of this work is to examine the consequences of diffraction on phase cancellation at the face of a single-element piezoelectric transducer. The long-term goal of this research is to develop mechanisms that compensate for the effects of diffraction. As an approach to understanding the physics underlying this complex phenomenon, in the present study spatial variations in the phase of the ultrasonic signal are induced by systematic rotation of the face of the receiving transducer. BackgroundA. Phase CancellationPhase cancellation across the face of a receiving transducer can be defined as the cancellation between positive and negative voltages across different locations on the surface of a receiving transducer. The different signs in voltage reflect the different signs of the velocities of particles in contact with the surface of the receiving transducer, which is a consequence of wavefront distortion as the ultrasonic wave approaches the receiving transducer. The concept of phase cancellation should not be confused with the concept of interference of wave fronts. In interference, the ultrasonic fields present at a particular point in space may add in a destructive or constructive manner. However, the total energy of the field is conserved. In contrast, phase cancellation across the face of a receiving transducer results in dissipation of energy in resistive losses in the electrodes of the transducer (Holland, 1989). In medical applications of ultrasound, phase cancellation is a very common phenomenon in throughtransmission detections involving inhomogeneous media, such as segments of bone or heart. For homogenous media, phase cancellation can also happen by misalignment of the surface of receiving transducer, thus creating phase differences, or wave front distortions. B. Introduction to Phase Sensitive and Phase Insensitive DetectionThe distinction between phase sensitive and phase insensitive detections is very important in ultrasonic measurements. In phase sensitive (PS) detections, signals received at each location across the face of the receiving transducer are combined before further procession, which may result in phase cancellation across the face of the transducer. Further analysis (such as computing the power spectrum) is based on this summed signal. In phase insensitive (PI) detections, analysis is first carried out of the power spectrum at each location across the face, and the total power is obtained by combining power at all locations. Phase insensitive detection does not involve the possible cancellation between positive and negative voltages, so it is not subject to the effect of phase cancellation. Phase insensitive detection analyzes power locally. Power is always a nonnegative quantity, so cancellation across different locations cannot occur. As a result, phase insensitive detection correctly estimates the amount of power that reaches the receiving transducer and in this regard it is the preferred detection method. On the other hand, phase sensitive detection, which is often susceptible to phase cancellation effects, underestimates the power that reaches the receiving transducer. In an experimental setting, phase sensitive detection only requires a single receiving transducer with an aperture on the scale of one centimeter. In contrast, phase insensitive detection, which analyzes signal at numerous specific locations across the face of the receiving transducer, requires an array of point-like receiving transducers, each with an aperture on the scale of one millimeter for wavelength typical of low megahertz frequency ultrasound. As a result, phase sensitive detection, which is usually cheaper and less technically challenging, remains widely used both in laboratories and in bone sonometry and related applications of ultrasound, despite its susceptibility to phase cancellation. C. Power Spectra of Phase Sensitive and Phase Insensitive DetectionA useful representation of an ultrasonic field is its frequency-domain power spectrum. A substantial amount of useful information for the characterization of an ultrasonic field can be obtained from its frequency content. Suppose the receiving transducer consists of an array of N hydrophones. If the digitalized wave form received by the nth hydrophone is defined as vn[tk], the phase sensitive power spectrum can be found with the following formula (1),
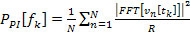
The corresponding phase insensitive power spectrum is obtained as (2)
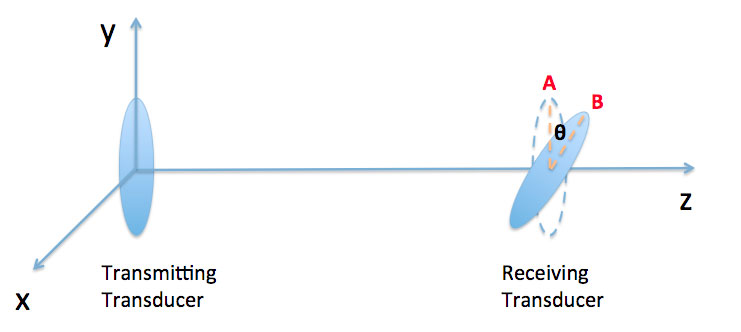
In both formulas, FFT stands for Fast Fourier Transform, and R is the appropriate impedance of the system (Holland, 1989). D. Zero-Padding of Time Domain SignalIn Fast Fourier Transform, a digitalized time-domain signal with m data points and resolution dt is converted into a digitalized frequency-domain signal with m data points and resolution df. The following equation relates dt, m and df (3): An approach for interpolation can be used to improve the resolution of power spectra by making df smaller. From (3) we see that this can be achieved by either increasing m, the number of points in the digital signal, or increasing dt. However, an increase in dt means worse resolution of time domain signal, which is undesirable. Therefore, the only feasible method is to increase m by appending values of zero on both ends of the time domain signal. This technique is called “zero-padding” and is employed in this study. E. Brief Introduction to FOCUSFOCUS (Fast Object-Oriented C++ Ultrasound Simulator) is a free cross-platform ultrasound simulation tool that calculates pressure fields generated by single element transducers and phased arrays (McGough, 2013). Developed by Professor Robert J. McGough and his colleagues from Michigan State University, FOCUS is capable of running both continuous and transient ultrasonic simulations. FOCUS is able to perform transient calculations quickly with less demand on computer memory by using Time-Space Decomposition (Kelly & McGough, 2009) (Kelly & McGough, 2006) (Chen & McGough). In this study, a combination of FOCUS Version 0.796 and MATLAB R2012a were used to run the simulations. SimulationsA. Setup of FOCUS SimulationIn this study, the effects of rotating receiving transducers for two different ultrasonic measurement systems are investigated with the help of FOCUS simulation. Each system consists of a transmitting transducer and receiving transducer of the same dimensions and frequency, both fully immersed in water. A broadband pulse propagates from the transmitting transducer, to the receiving transducer, where the time-domain waveform is recorded. To perform transient wave simulations in FOCUS, a transducer object must be defined and the propagation medium, which was water in this case, must be specified first. FOCUS also requires an input waveform to be specified. Then a 4 dimensional coordinate system with 3 spatial dimensions (x,y,z) and 1 time dimension (t) needs to be defined. FOCUS will calculate the particle velocity field generated by the transducer as a function of (x,y,z,t). Because the transmitting transducer has a circular surface and can be reasonably assumed to be cylindrically symmetric, the resulting velocity field can also be assumed to be cylindrically symmetric, so only 3 dimensions (r,z,t) where
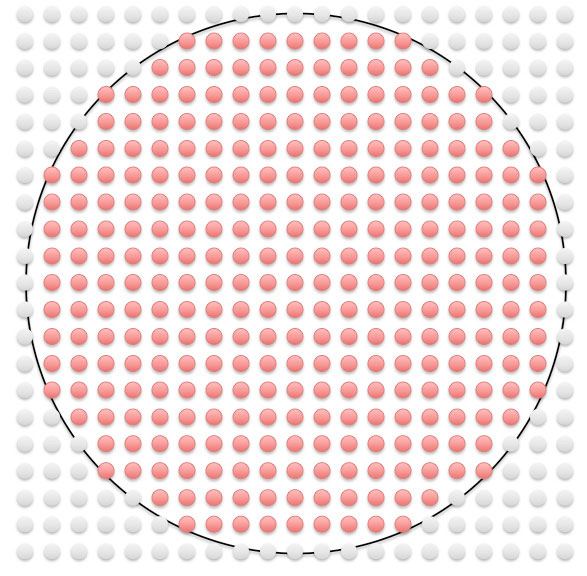
Figure 1: Configuration of the ultrasonic system. An ultrasonic wave propagates from the transmitting transducer through water to a receiving transducer. The receiving transducer can be rotated about the x-axis by a certain angle θ, typically between 0 and 10 degrees (exaggerated for the ease of viewing). To make sure that the waveforms calculated at θ=0 and θ=θ’>0 are significantly different, a high resolution on the z-axis is needed so that there can be enough points in the z direction separating A and B. In the case of θ’=1° the number of such points is defined as the “degree of fineness” (DOF) and it is expected to be >10. The receiving transducer is modeled to be composed of N receiving transducers (sometimes known as hydrophones ). For each rotation angle θ (Figure 1), each hydrophone is located at position (x,y,z), which can be further simplified into (r,z) as described above. Given the (r,z) coordinates and the velocity field calculated by FOCUS, we can find Choosing a suitable resolution of the (r,z,t) grid is important. On one hand, we cannot make the resolution so high that the memory available in our computer is inadequate. On the other hand, we cannot make the resolution too low so that: 1) a very low resolution in time could fail to meet the Nyquist sampling criterion, resulting in a distorted waveform, or 2) a very low resolution in r and z dimensions (especially z) could mean that there is little or no difference between the waveforms acquired at θ=0 and θ=θ’>0. The first issue can be addressed by setting dt, the time difference between two neighboring points on the time axis, to be no bigger than the Nyquist value. The second issue can be tackled by requiring that DOF, as defined in the Figure 1, to be greater than a certain value, which is chosen to be 10. The hydrophones should be placed throughout the face of the receiving transducer with even density. A way to accomplish this is to imagine a square grid covering the face of the receiving transducer, and hydrophones are placed at all the grid points lying inside the boundaries of the face of the receiving transducer, as shown in Figure 2.
Figure 2: Location of hypothetical point-like ultrasonic receiving transducer. A 21x21 square grid is superimposed onto the face of the receiving transducer (shown as a black circle). Red dots that lie inside the circle are the sites where a hypothetical hydrophone is placed and B. Results of FOCUS Simulation and Comparison with Results from Laboratory WorkFigure 3A shows the FOCUS simulated phase sensitive power spectra of transducer set 1 for θ=0° to θ=10° in increments of 1°. Figure 3B shows the power spectra of the same transducer calculated from actual laboratory data. In our laboratory a single circular transducer, instead of an array of hydrophones, is used as the receiver, so the laboratory data are results of phase sensitive detection. Table 1. Parameters of the two sets of ultrasonic transducers being investigated and the resolution in (r,z,t) space used in FOCUS simulations.
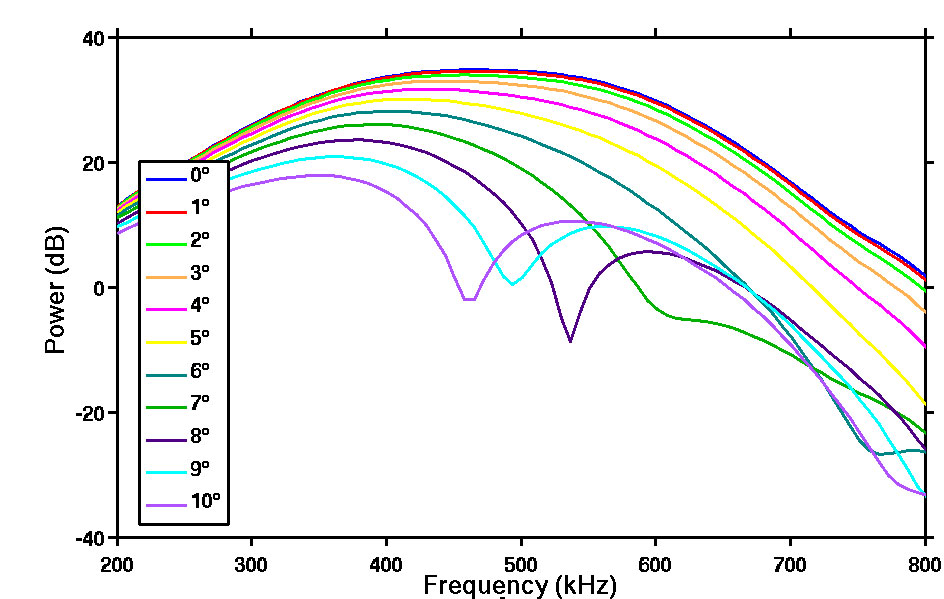
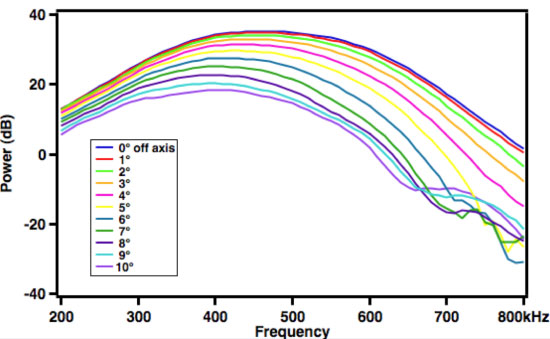
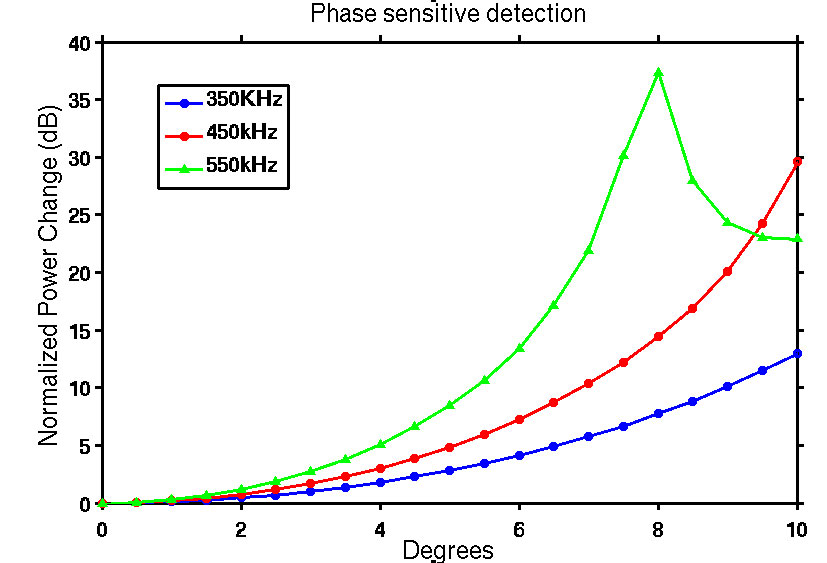
Figure 3: (A - Left) Plot of phase sensitive power versus frequency at different values of θ for transducer set 1 based on FOCUS simulations. (B - Right) Plot of phase sensitive power versus frequency at different values of θ for transducer set 1 based on laboratory data. Apart from minor disagreements in higher values of θ, these two plots agree with each other extremely well. A nonzero value of θ can significantly weaken the power received by a receiving transducer in the case of phase sensitive detection. Figure 4A shows FOCUS simulated phase sensitive normalized power change as a function of rotation angle θ at three different frequencies for transducer set 1. Figure 4B is similar to Figure 4A but uses laboratory data instead. It is clear that more and more power is lost as the rotation angle of receiving transducer increases. For the same rotation angle, a higher frequency is correlated to more power loss.
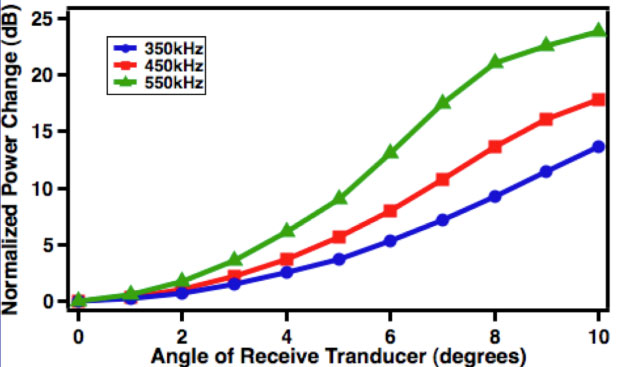
Figure 4: (A - Left) Plot of “normalized power change,” the power loss due to misalignment at three different frequencies as a function of θ based on FOCUS simulation results. (B - Right) Same as (A) but based on laboratory data . For both (A) and (B), transducer set 1 is used. Figure 5 shows the FOCUS simulated phase insensitive power spectra of transducer set 1. Notice that the power spectra for different angles are very similar.
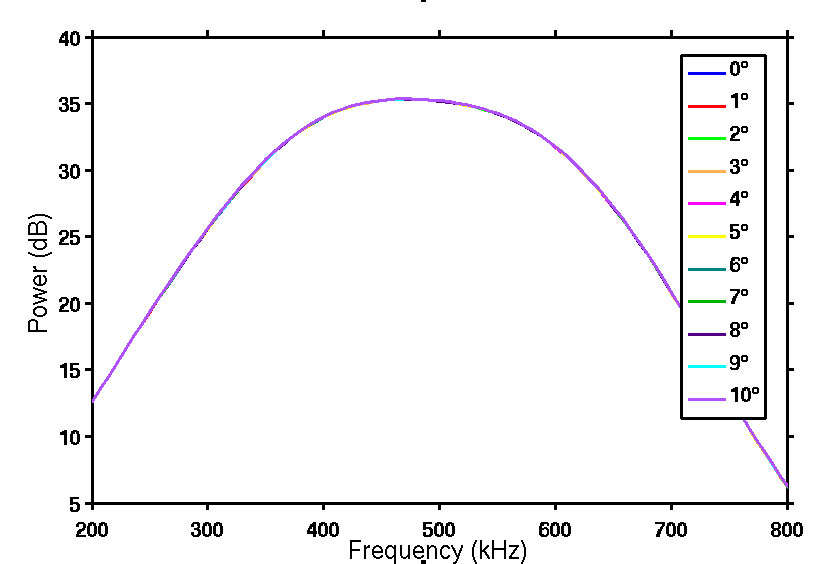
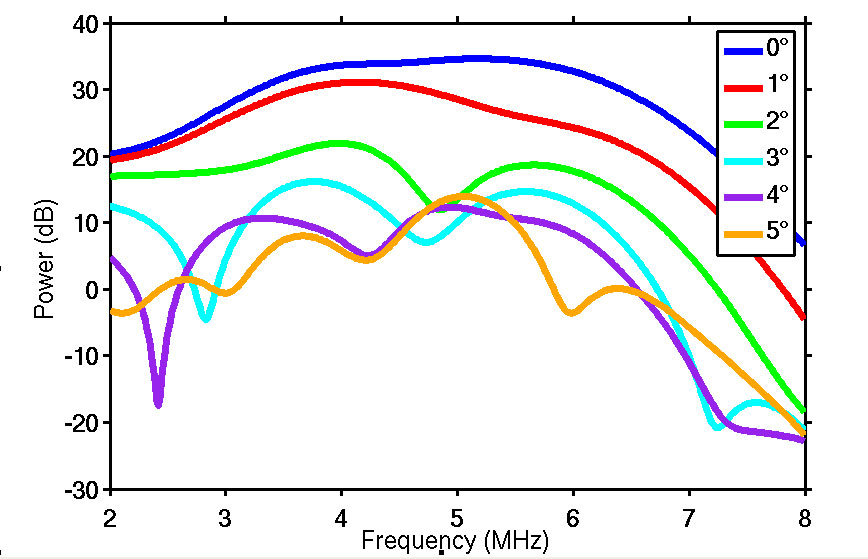
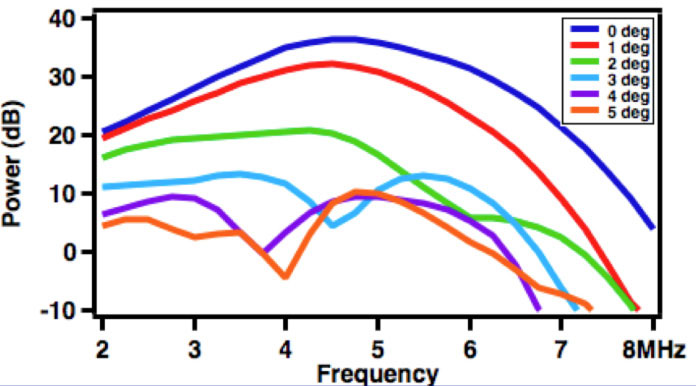
Figure 5: Plot of phase insensitive power versus frequency at different values of θ for transducer set 1 based on FOCUS simulations. The power spectra for different values of θ are very similar, which is proof that phase insensitive detection is not susceptible to power losses caused by phase cancellation. Laboratory results are unavailable as it is very difficult to do phase insensitive detection in a laboratory setting. Figure 6A shows the FOCUS simulated phase sensitive power spectra of transducer set 2 for θ=0° to θ=5° in increments of 1°. Figure 6B shows the power spectra of the same transducer calculated from actual laboratory data, which is also phase sensitive.
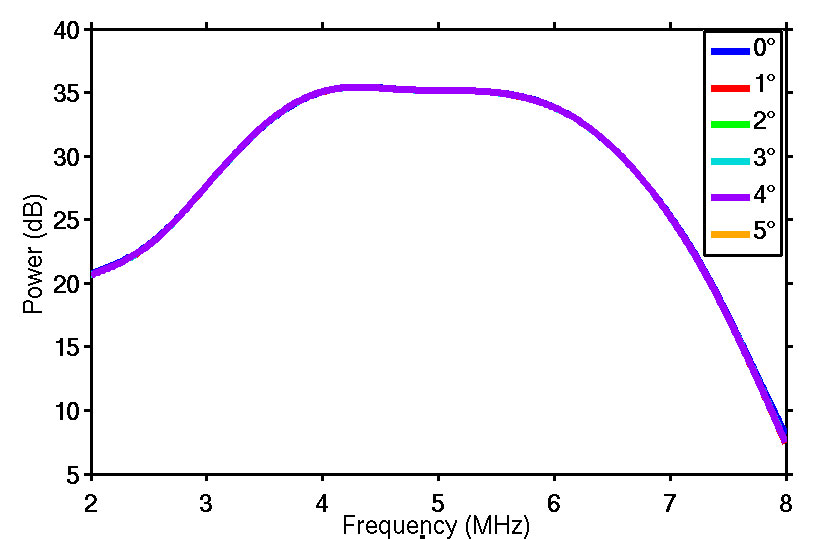
Figure 6: (A - Left) Plot of phase sensitive power versus frequency at different values of θ for transducer set 2 based on FOCUS simulations. (B - Right) Plot of phase sensitive power versus frequency at different values of θ for transducer set 2 based on laboratory data. Apart from minor disagreements in higher values of θ, these two plots agree with each other extremely well. A nonzero value of θ can significantly weaken the power received by a receiving transducer in the case of phase sensitive detection. Figure 7 shows the FOCUS simulated phase insensitive power spectra of transducer set 2. Notice that the power spectra for different angles are very similar.
Figure 7: Plot of phase insensitive power versus frequency at different values of θ for transducer set 2 based on FOCUS simulations. The power spectra for different values of θ are very similar; a proof that phase insensitive detection is not susceptible to power losses caused by phase cancellation. Laboratory results are unavailable as it is very difficult to do phase insensitive detection in a laboratory setting. DiscussionIssues associated with the diffraction of ultrasonic waves as they propagate through inhomogeneous media present challenges for quantitative determination of material properties of specimens such as potentially osteoporotic bones. In order to investigate some of the physics underlying the diffraction of propagating ultrasonic waves, this investigation made use of a homogenous medium (water) to investigate the impact on quantitative measurements of phase variation across the face of a receiving transducer. Systematic variations in phase were achieved by rotation of the plane of the receiving transducer relative to the direction of propagation of the ultrasonic beam. Such small variations in angle would not be expected to alter significantly the power spectrum of the received ultrasonic signal. However, results of this investigation indicate that the apparent magnitude of the power as a function of frequency varies dramatically in the case of phase sensitive reception. In contrast, with the use of phase insensitive detection, the power spectrum is quite stable over the entire range of angles investigated. These results suggest the potential benefit of employing phase insensitive detection in the investigations of material properties. AuthorYu Tao “Roger” Li is an undergraduate student from Washington University of St. Louis. He is majoring in physics and mathematics and received Arthur Holly Compton Fellowships in the Physical Sciences and Mathematics in Fall 2011, which covers full tuition fee for every semester. He has been working with Professor James G. Miller in his Laboratory for Ultrasonics since February 2012. He is currently in the process of applying to physics graduate programs. ReferencesChen, D., & McGough, R. J. (2008). A 2D fast near-field method for calculating near-field pressures generated by apodized rectangular pistons. J. Acoust. Soc. Am. , 124 (5), 1526-1537. Holland, M. R. (1989). Analysis of phase-distorted scattered ultrasound with a two-dimensional receiving array. Washington University in St. Louis, Physics. St. Louis: Washington University in St. Louis. Kelly, J. F., & McGough, R. J. (2006). A Time-Space Decomposition Method for Calculating the Nearfield Pressure Generated by a Pulsed Circular Piston. IEEE Transaction Ultrasonics Ferroelectics, Frequency Control, 53 (6), 1150-1159. Kelly, J. F., & McGough, R. J. (2009). Transient field generated by spherical shells in viscous media. 8th International Symposium on Therapeutic Ultrasound , 1113, 210-214. McGough, R. J. (2013, August 20). FOCUS | Michigan State University. Retrieved August 20, 2013, from http://www.egr.msu.edu/~fultrasweb/index.php From the Inquiries Journal Blog   Related ReadingJournalQuest is a free program to help academic student publications increase online readership and distribution. If you are interested in enrolling a journal at your school, please visit the JournalQuest website. Monthly Newsletter SignupThe newsletter highlights recent selections from the journal and useful tips from our blog. Suggested Reading from Inquiries Journal
Inquiries Journal provides undergraduate and graduate students around the world a platform for the wide dissemination of academic work over a range of core disciplines. Representing the work of students from hundreds of institutions around the globe, Inquiries Journal's large database of academic articles is completely free. Learn more | Blog | Submit Follow IJ
Latest in |