From Discussions VOL. 10 NO. 1Toward A More Sustainable Food Supply Network: An Economic Analysis of Sustainability in the United States Food Industry
IN THIS ARTICLE
KEYWORDS
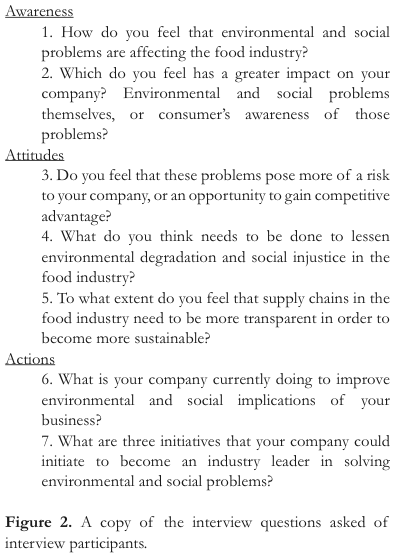
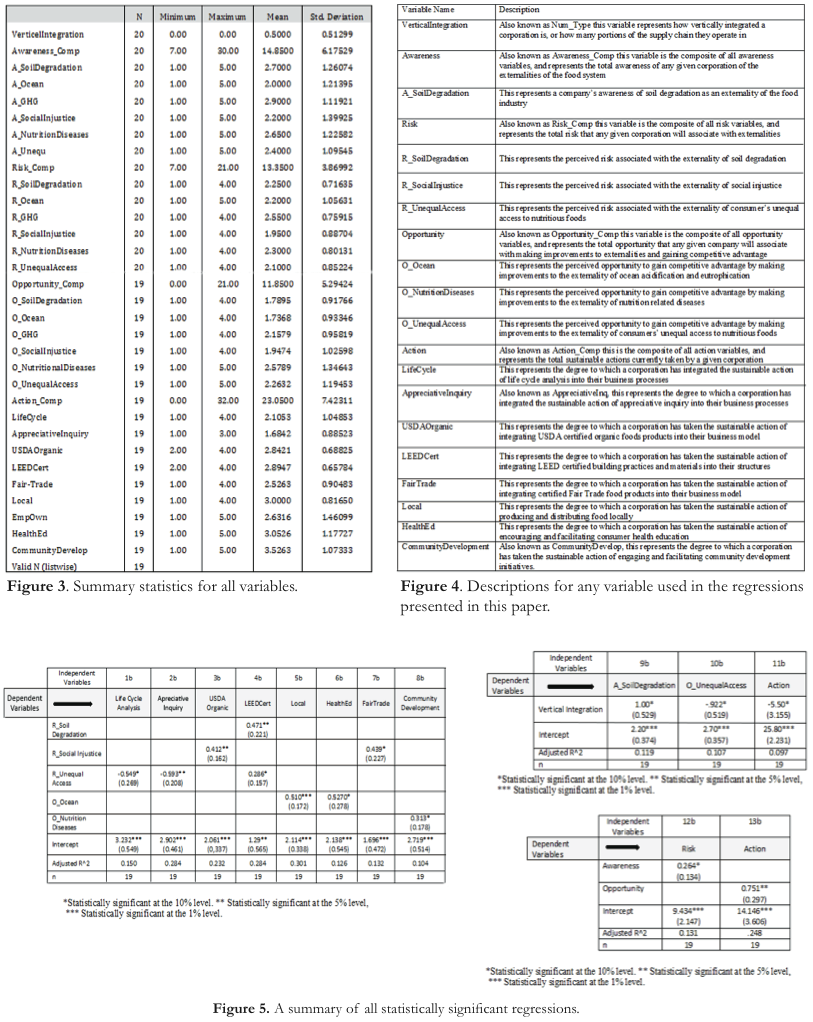
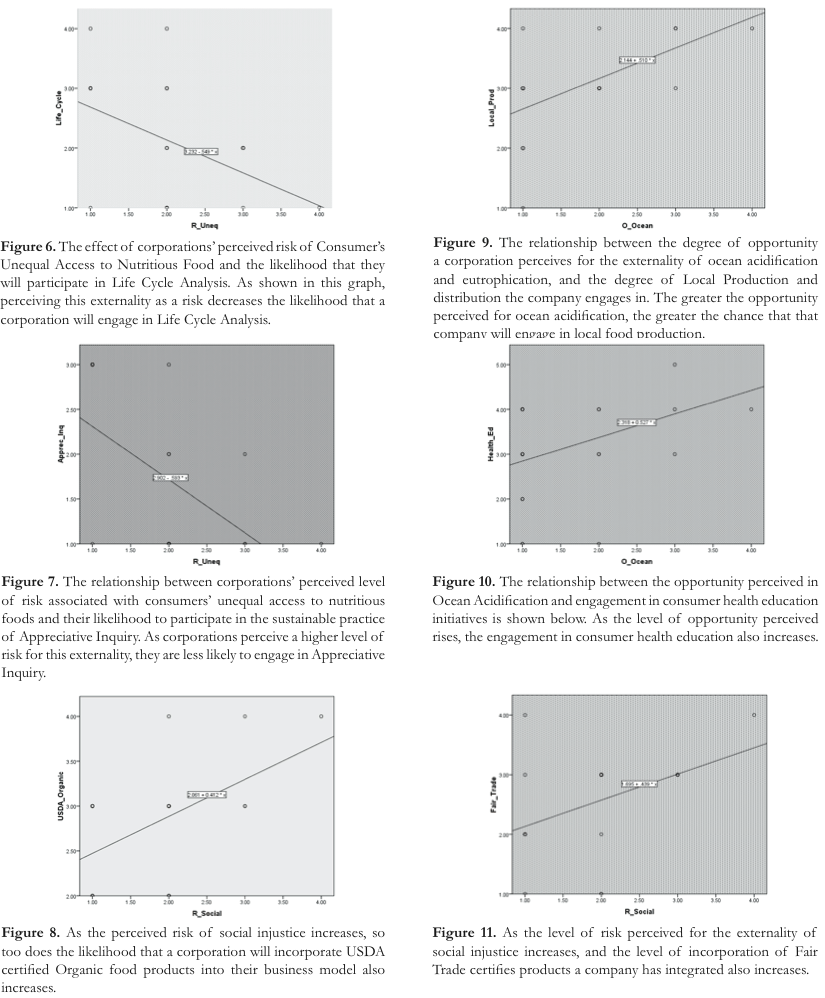
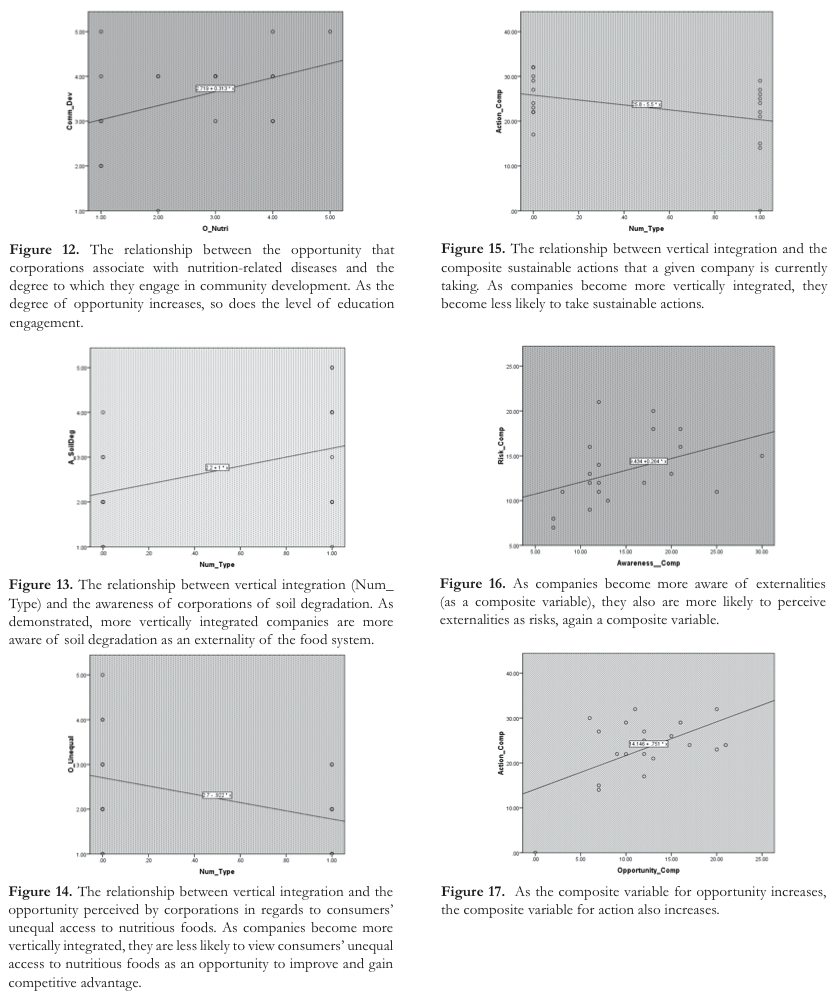
AbstractIn order to determine the current state of the industrial food system, both a quantitative survey and a qualitative interview were conducted and administered to various food corporations in the United States. These surveys assessed the corporations’ current awareness, attitudes, and actions in regards to analysis to the data collected, it becomes clear that perceptions of risk and directly affect the degree of sustainable action that a given corporation takes. Additionally, the relationship between vertical integration and sustainable of sustainable action is the ability to recognize environmental and social externalities as opportunities to gain a competitive advantage. INTRODUCTIONAs the debate over the ethics of what we eat becomes more prominent and inclusive, it is important to look at the complex problem from a whole systems approach. Through holistic exploration, the human food system presents externalities in the areas of human health (Simon, 2006, p. xiii), social equality (Patel, 2007, p. 194), environmental degradation (Jackson, 2010, p. 154), and animal welfare (Singer & Mason, 2006, 45). Most notably, by exploring the chain of interactions that occur from farm to fork, it becomes apparent that the current industrial design of food processing and distribution pressures farmers in a manner that is detrimental to their personal health (Patel, 2007, 183). The current human food chain creates a force working against both producers and concentrated corporations in the supply chain (Patel, 2007, p. 12). While several consumer-driven alternatives have accelerated in prevalence, a discussion of the validity of these alternatives reveals that these movements alone may not be enough to change to the system as a whole; but with the action from key actors within the web of the current industrial system, true sustainability can be reached (Jackson, 2010, p. 169). Studying the current state of the industrial food system allows for an understanding of the mechanisms that encourage companies to act sustainably and how to further incentivize this type of action. METHODOLOGYIn order to analyze the current state of the United States Food Industry, I created both a quantitative survey and a qualitative interview to be administered to prominent food corporations. I created the sample for my survey by listing the most prominent food corporations in each sector of the industry and accounted for the following: production, processing, distribution, wholesale, retail (grocery), and industrial catering (restaurants). The corporations were selected based on a cross reference of public records of prominent distribution companies (Top 75, 2012; Top 50, 2013; Food Processing’s, 2012), and public documents from the USDA (USDA Export, 2002). Once this list was created, I contacted each company for contact ranking individual who would have a holistic view of the company and its operations. I attained 109 email addresses and administered an online survey to these individuals via an online survey website, and then sent 100 print surveys via traditional mail to 100 corporations from my original list that I had not attained the contact information for. Collectively, my sample consisted of 209 individual corporations throughout the food supply chain. I received a response rate of 40% for the online sample (including incomplete surveys) and a 20.6% response rate over the entire sample. Regarding only completed surveys, I received a 14.7% response rate from the online sample and a 9% response rate over the entire sample. Interviews consisted of seven individuals, each from a different food corporation throughout the supply chain, and were conducted after the survey had closed. The survey was comprised of 36 questions, split into sections of basic information (i.e. name, company name, title, etc.), awareness of unsustainable externalities of the food system, attitudes on such externalities (i.e.: perceptions taken by each corporation (Figure 1). The six proven externalities presented were documented regarding the food system, and each action proposed was a solution towards attaining sustainability. Intensive farming procedures and increased use of nitrogen- and phosphorous- based fertilizers and other intensive farming procedures have led to an increase in soil degradation levels (Jackson, 2007, p. 130). This increased use has also led to ocean eutrophication, among other issues of local water contamination (Mackenzie, F. T., Ver, L. M., Lerman, A, 2002, p. 16). Additionally, the agriculture industry is a major emitter of greenhouse gases, including carbon dioxide and methane (Patel, 2007, p. 299). It is also documented that the industrial food system supports social injustice (Patel, 2007, p. 25), and has led to increased levels of nutrition-related diseases (Pollan, 2008, p. 10). Finally, consumers are facing unequal access to nutritious foods, also known as the “food and those without (Winne, 2008, p. xi). These are thus the six eutrophication, greenhouse gas emissions, social injustice, nutrition-related diseases, and unequal access to nutritious food. Furthermore, it has been proposed that Life Cycle Analysis (Guinee & Heijungs, 2011, p. 657), Appreciative (Martin, 2009, 77), localized food production and distribution (Pollan, 2006, p. 249), employee ownership (Beyster, 2008, p. 29), consumer health education (Carmona, 2005, p. 9), and community development (Blandy & Fenn, 2012, 274) could all be potential solutions to the externalities created by our society and the food industry, and will thus be used as the sustainable actions in my analysis. Each survey question was asked on a scale with five choices, typically from “Not at all” to “Extremely,” in the context of each question. The interviews were sets of seven questions relating to the survey questions and inquiring into further detail about the awareness, attitudes, and actions of each company interviewed (Figure 2). Having collected the data, I then ran 241 regressions using the statistical program, SPSS, in order to determine what, if any, relationships existed between the variables in discussed in this paper. Qualitative data from the interviews were then compared to the statistical regressions. DATAThe data used in the statistical regressions included 27 numerical variables each recoded on a scale of one “Extremely” or “Exclusively.” Figures 3 and 4 provide the full statistical summary and description of each of the variables used, respectively. Qualitative variables including the company name, respondent name, and respondent title were not used in statistical regression. In addition to the 27 numerical variables, a dummy variable indicating a binary response out of a categorical question was created to indicate any and all sectors of the food business their able to select food production, food processing, food distribution, food wholesale, food retail (grocery), industrial catering (restaurants), and an option for other. In order to use this variable as a measure of vertical integration, or how much of the supply chain an individual company respondent selected. I recoded these numbers into either “vertically integrated” for respondents who were involved in three or more sectors of the supply chain or “not vertically integrated” for respondents who were involved in two or less sectors. Additionally, composite variables were created for each the composite question sections of awareness, risk attitude, opportunity attitude, and action. Each variable was created by taking the sum of each category’s variable responses. Including the dummy variable and composite variables, 32 variables were used for regression analysis. Empirical Model ResultsFor each relationship analyzed through regression, the relationship both in terms of correlation and in terms of how well that equation explains the relationship of the independent variable(s) on the dependent variable. The that corporations associate with consumer’s unequal access to nutritious food and the likelihood that they will initiate the sustainable practice of life cycle analysis. The relationship will produce the following empirical model: 1a. LifeCycleAnalysis = β0β1 R_UnequalAccess + ui where LifeCycleAnalysis represents the predicted degree to which corporations will initiate and engage in life cycle analysis at their corporation. 0 represents the intercept, or what Y (LifeCycleAnalysis) will equal when X (R_ UnequalAccess) equals zero. 1 UnequalAccess. This number will be generated by the regression. R_UnequalAccess represents the degree to which a given corporation associates consumer’s unequal access to nutritious foods as a risk to their corporation. ui represents the error term, or how far off the actual value of life cycle analysis is from the predicted value of LifeCycleAnalysis. The results of all regressions are detailed in Figure 5. The regression between consumer’s unequal access to nutritious foods and the engagement in life cycle analysis produced the following equation, with the standard errors for each figure below each coefficient estimate: 1b. LifeCycleAnalysis = 3.232 (0.549) - 0.549 (0.269) R_UnequalAccess + ui The intercept is statistically significant at the 1% level and the coefficient of the R_UnequalAccess is statistically significant at the 10% level. The adjusted R2 value is 0.150, meaning that this equation shows a 15% explanation of the change in the degree of engagement in life cycle analysis. What this equation means is that the more a company views consumer’s unequal access to nutritious foods as a risk, the less likely they are to engage in life cycle analysis. Figure 6 provides a graph of the relationship between the risk of consumer’s unequal access to nutritious foods and corporations’ engagement in life cycle analysis. The second relationship I found between the attitudes of a corporation and their propensity to take sustainable action is between the risks corporations associate with unequal access to nutritious foods and the sustainable following empirical model: 2a. AppreciativeInquiry = β0β1 R_UnequalAccess + ui where AppreciativeInquiry represents the predicted degree to which a given company engages in Appreciative Inquiry practices in their corporation. All other variables represent (1a). The regression produced the following equation, with estimate: 2b. AppreciativeInquiry = 2.902 (0.461) - 0.593 (0.208) R_UnequalAccess + ui The intercept is statistically significant at the 1% level, and the coefficient or R_UnequalAccess is statistically significant at the 5% level. The adjusted R2 value is .284, meaning that this equation shows a 28.4% explanation of the change in the degree of engagement regarding appreciative inquiry. Essentially, the more a company views consumer’s unequal access to nutritious foods as a risk, the less likely they are to engage in appreciative inquiry. Figure 7 provides a graph of the relationship between the risk of consumer’s unequal access to nutritious foods and corporations’ engagement in appreciative inquiry. The relationship of the last two regressions indicates that as companies perceive consumer’s unequal access to nutritious foods, they become less likely to engage in specific sustainable activities.Continued on Next Page » From the Inquiries Journal Blog  ") Related ReadingJournalQuest is a free program to help academic student publications increase online readership and distribution. If you are interested in enrolling a journal at your school, please visit the JournalQuest website. Monthly Newsletter SignupThe newsletter highlights recent selections from the journal and useful tips from our blog. Suggested Reading from Inquiries Journal
Inquiries Journal provides undergraduate and graduate students around the world a platform for the wide dissemination of academic work over a range of core disciplines. Representing the work of students from hundreds of institutions around the globe, Inquiries Journal's large database of academic articles is completely free. Learn more | Blog | Submit Follow IJ
Latest in Economics |