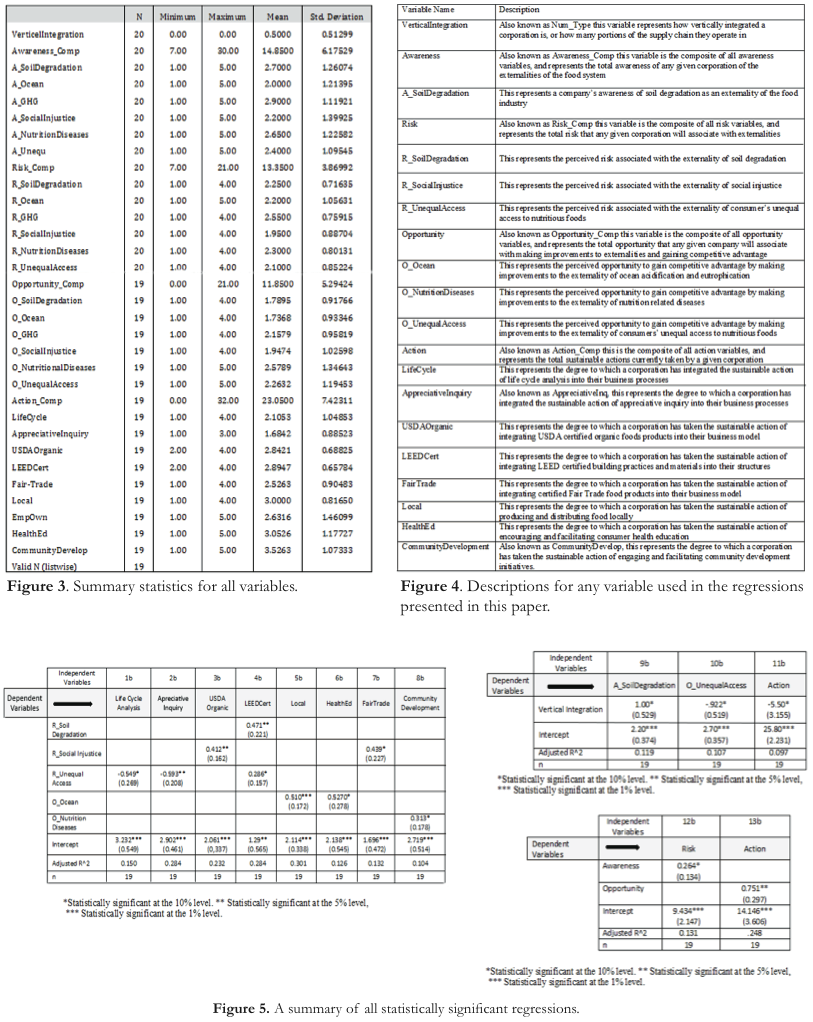
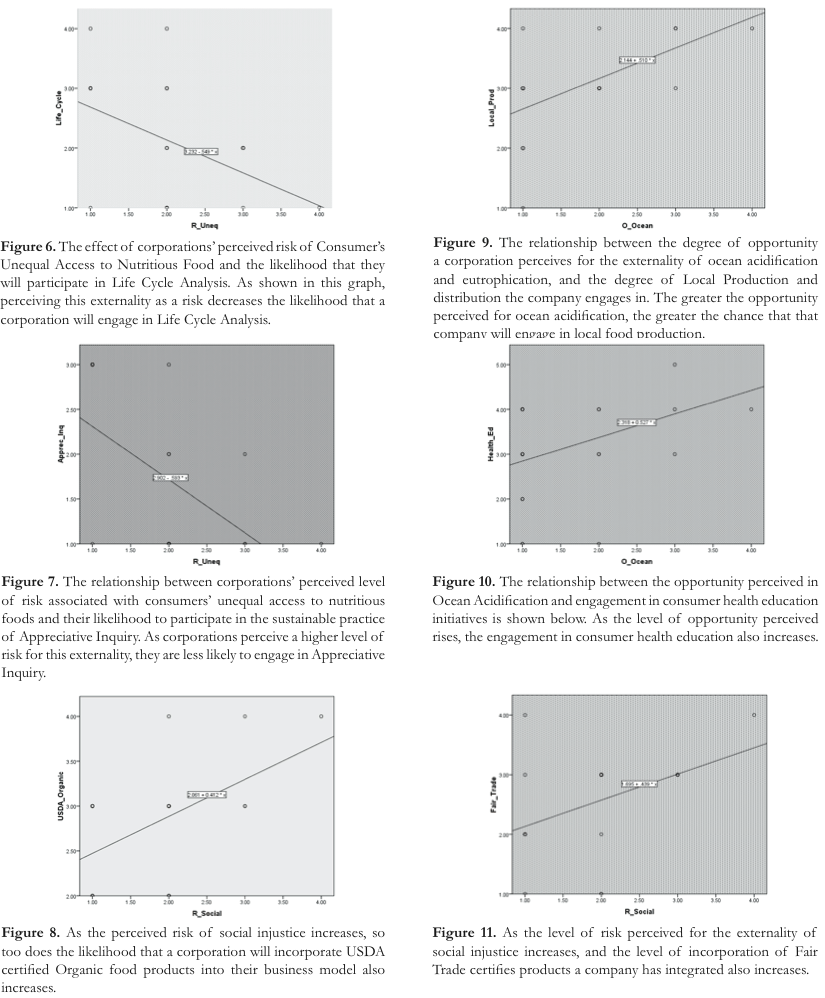
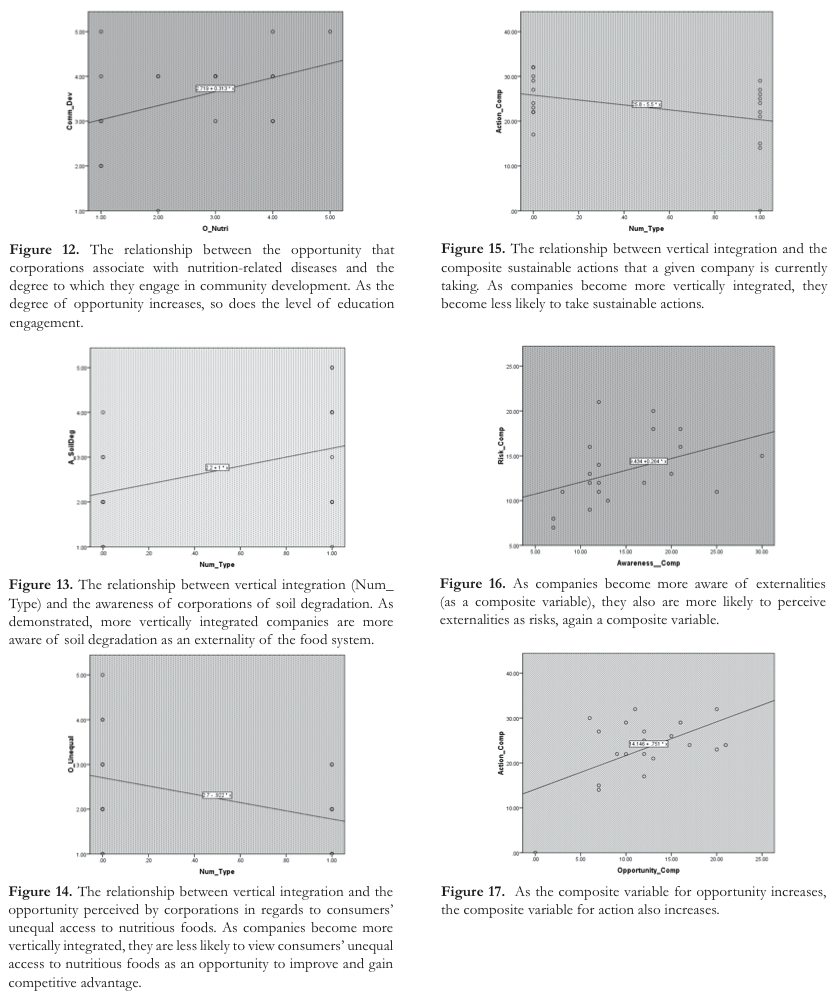
From Discussions VOL. 10 NO. 1Toward A More Sustainable Food Supply Network: An Economic Analysis of Sustainability in the United States Food IndustryThe third relationship between corporate attitudes and sustainable action is the degree to which a corporation views social injustice as a risk, and the degree to which they include USDA Organic products in their business model. The relationship will produce the following empirical model: 3a. USDAOrganic = β0β1 R_SocialInjustice + ui where USDAOrganic represents the predicted degree to food products in their business model. 0 represents the intercept and 1SocialInjustice, with both generated by the regression. R_SocialInjustice represents the degree to which a given corporation views social injustice as a risk. ui represents the error term. Running the regression produced the following equation, with the standard errors for each figure below each coefficient estimate: 3b. USDAOrganic = 2.061(0.337) + 0.412 (0.162)R_SocialInjustice + ui The intercept is statistically significant at the 1% level and the coefficient of R_SocialInjustice is significant at the 5% level. The adjusted R^2 value is .232; this equation shows a 23.2% explanation in the change of the degree of incorporation of organic food products. The more a corporation views social injustice as a risk to their own company, the more likely they are to include USDA organic food products in their business model. A graph was produced of the relationship between the risk of social injustice and corporations’ engagement in incorporating organic food products (Figure 8). The fourth relationship between a corporation’s perceived risks and their likelihood to take sustainable action is the correlation of both the perceived risks of consumer’s unequal access to nutritious foods and soil degradation to the degree to which a corporation has integrated LEED relationship will produce the following empirical model: 4a. LEEDCert = β0β1 R_SoilDegradation + 2R_UnequalAccess + ui where LEEDCert represents the degree of company materials into their structures. 0 represents the intercept, 12which are generated by the regression. R_SoilDegradation represents the degree to which a given corporation views soil degradation as a risk to their corporation, and R_ UnequalAccess represents the same perception of risk for consumer’s unequal access to nutritious food. ui represents the error term. Running the regression produced the following equation, with the standard errors for each figure below each coefficient estimate: 4b. LEEDCert = 1.29 (0.565) + 0.471 (0.221) R_SoilDegradation + 0.286R_UnequalAccess + ui(0.565)(0.221)(0.157) Both the intercept and the coefficients of R_SoilDegradation are statistically significant at the 5% level. The adjusted R2 value is .270, so this equation shows a 27% explanation in the change of the degree of engagement degradation and unequal access to nutritious foods as risks to their own company, the more likely they are to the previous regression, we can see a relationship between how perceptions of both environmental and social risks can improve a company’s sustainable actions, whereas only considering perceptions of social injustice as a risk decreases In addition to the impact that perceptions of risks can have on the actions a corporation takes, recognition of of this variety that I discovered was between the perception to improve and gain competitive advantage, with the sustainable action of local food production and distribution. This relationship produced the following empirical model: 5a. Local = β0 + β1 O_Ocean + ui where Local represents the predicted degree to which corporations will engage in local food production and distribution.0 represents the intercept and 1 represents generated by the regression. O_Ocean represents the degree and eutrophication as an opportunity for their corporation to improve and gain competitive advantage. u_i represents the error term. The regression produced the following equation, with the standard errors for each figure below each coefficient estimate: 5b. Local = 2.114 (0.338) + 0.510 (0.172) O_Ocean + ui Both the intercept and coefficient of O_Ocean are statistically significant at the 1% level, and the adjusted R2 value is .301, meaning that this equation shows a 30.1% explanation of the change in local production, which is very opportunity to improve and gain competitive advantage, the more likely they are to engage in local food production and distribution. A graph of the relationship between the perception of opportunity of ocean acidification and local food production is provided (Figure 9). Similarly, there is also a relationship between the perception of opportunity surrounding ocean acidification and the engagement of corporations in consumer health initiatives. The regression will produce the following empirical model: 6a. HealthEd = β0β1 O_Ocean + ui where HealthEd represents the predicted degree to which corporations will engage in consumer health education and variables as in the previous regression (5a). Running the regression produced the following equation: 6b. HealthEd = 2.138 (0.545) + 0.527 (0.278) O_Ocean + ui This equation shows a 12.6% explanation of the change in consumer health education. Similarly, eutrophication as an opportunity to improve and gain competitive advantage, the more likely they are to engage in consumer health education initiatives. There were an additional two regressions that correlated and showed relationships between attitudes on closely linked externalities and sustainable actions. The likelihood of a company to perceive social injustice as a risk to their own company and the likelihood that they would produced the following empirical model: 7a. FairTrade = β0β1 R_SocialInjustice + ui where FairTrade represents the degree to which a company model. 0 represents the intercept and 1 represents the be generated by the regression. R_SocialInjustice represents the degree to which a given corporation perceives social injustice as a risk. ui represents the error term. The regression produced the following results, with the standard errors for each figure below each coefficient estimate: 7b. FairTrade = 1.695 (0.472) + 0.439 (0.227) R_SocialInjustice + ui 2 This equation states that companies that feel that social injustice is a great risk to their corporation are more likely to integrate Fair Trade is essentially a sustainable solution to the social injustice in our global food system. The corporations that view social injustice as a risky externality are more likely to take precautions to manage this risk by incorporating Fair Trade products into their business procedures. A graph of the correlation between attitudes of risk about social injustice and the sustainable action of fair trade is displayed in Figure 11. Another logical relationship between attitudes and action is seen between the opportunity corporations perceive in regards to nutrition-related diseases and the degree of community development a corporation engages in. The empirical model that that relationship creates is as follows: 8a. CommunityDevelopment = β0 + β1 O_NutritionDiseases + ui where CommunityDevelopment represents the degree to which a company is engaged in community development. 0 represents the intercept and 1of O_NutritionDiseases. These numbers are generated by the regression. O_NutritionDiseases represents the degree to which a given corporation perceives nutrition-related diseases as an opportunity to improve and gain competitive advantage. u_i represents the error term. The regression produced the following results 8b. CommunityDevelopment = 2.719 (0.514) + .313 (0.178) O_NutritionDiseases + ui The intercept is statistically significant at the 1% level, and the coefficient on O_NutritionDiseases is significant at the 10% level. The adjusted R2 level is 0.104, which means that 10.4% of the change in community development can be explained by this equation. The equation demonstrates that the corporations that perceive nutrition-related diseases as an opportunity to gain a competitive advantage are more likely to engage in community development. This is relatively logical: Corporations that see nutrition-related diseases as an opportunity to gain a competitive advantage use community nutrition-related diseases and the sustainable action of graph of this relationship was created (Figure 12). Another set of relationships I discovered was between vertical integration and various aspects of relationship I discovered was between vertical integration and corporations’ awareness of soil degradation. The empirical model for this relationship is as follows: 9a. A_SoilDegradation = β0 + β1 VerticalIntegration + ui A_SoilDegradation represents the predicted level of awareness a corporation will have of soil degradation.0 represents the intercept, or what Y (A_SoilDegradation) will equal when X (VerticalIntegration) equals zero.1 represents represents whether or not the respondent’s corporation is vertically integrated. ui represents the error term, or how far off the actual value of awareness is from the predicted value of A_SoilDegradation. The regression between vertical integration and corporations’ awareness of soil degradation produced the following equation: 9b. A_SoilDegradation = 2.20 (0.374) + 1.00 (0.529) VerticalIntegration + ui The adjusted R2 value is 0.119, meaning that this equation shows an 11.9% explanation in the change in awareness for soil degradation. Essentially, the more vertically integrated a company is, the more likely it is that they are aware of soil degradation as an externality of the food supply system. The relationship between Vertical Integration and corporations’ awareness of soil degradation is seen in Figure 13. The second relationship found was between vertical integration and the likelihood that corporations will view consumer’s unequal access to nutritious food as an opportunity to improve their practices and gain competitive advantage. The empirical model for this relationship is as follows: 10a. O_UnequalAccess = β0 + β1 VerticalIntegration + ui O_UnequalAccess represents the predicted level of opportunity a corporation will associate with consumer’s unequal access to nutritious food. All other variables regression (9a). The regression produced the following equation: 10b. O_UnequalAccess = 2.70 (0.357) - .922 (0.519) VerticalIntegration + ui The adjusted R2 value is 0.107, meaning that this equation shows a 10.7% explanation in the change in opportunity perceived in improving consumer’s unequal access to nutritious foods. Essentially, the more vertically integrated a company is, the less they will see consumer’s unequal access to nutritious foods as an opportunity to gain competitive advantage. A graphical representation of the relationship between Vertical Integration and corporations’ perception of opportunity in consumer’s unequal access to nutritious foods was created (Figure 14). The third relationship correlated vertical integration’s effect on the composite variable for action. This tested the relationship between how vertically integrated a corporation is and the level of sustainable actions they currently have initiated. The empirical model for this relationship is as follows: 11a. Action = β0β1 VerticalIntegration + ui represents the predicted level of sustainable actions a corporation will initiate and engage in. The regression produced the following equation: 11b. Action = 25.80 (2.231) - 5.50 (3.155) VerticalIntegration + ui The adjusted R2 value is 0.097, meaning that this equation shows a 9.7% explanation in the change in sustainable action taken by a given corporation. The more vertically integrated a company is, the less they will take sustainable action. A graphical representation of the relationship between Vertical Integration and Action was produced (Figure 15). Taking this in accordance with the may make companies more aware of the externality of soil degradation, they are less likely to perceive consumer’s unequal access to nutritious foods as an opportunity, making them less likely to take any sustainable action. Finally, there are two relationships between composite variables that contribute to the depth of understanding between the variables in this set of data. The awareness and the composite attitude variable for risk. The following is the empirical model for this relationship: 12a. Risk = β0β1 Awareness + ui where Risk represents the predicted level of composite risk a corporation will perceive for all externalities.0 represents the intercept and 1Awareness represents the composite awareness of a given corporation of all externalities of the food system. ui represents the error term. The regression between awareness and corporations’ perception of risk produced the following equation: 12b. Risk = 9.434 (2.147) + 0.264 (0.134) Awareness + ui There is an adjusted R2 value of 0.131, meaning that 13.1% of the change in Risk is explained by this equation. From this equation, we learn that as companies become more aware of externalities, they become more likely to perceive those externalities as risks. As we viewed earlier, an increase in the perception of risk does not necessarily lead to an increase in action. Figure 16 contains the graphical representation of the relationship between Risk and Awareness. variables is between the composite variable for perceived opportunities for externalities and the composite variable for taking sustainable action. This relationship created the following empirical model: 13a. Action = β0β1 Opportunity + ui where Action represents the predicted level of composite sustainable action a given corporation will take. 0 represents the intercept and 1Opportunity represents the composite opportunity a given company will associate with all externalities of the food system. ui represents the error term. This regression created 13b. Action = 14.146 (3.606) + 0.751 (0.279) Opportunity + ui The adjusted R2 value of 0.248 means that 24.8% of the change in Action is explained by the equation. This equation means that as corporations perceive externalities as more of an opportunity, they are more likely to take sustainable action. This, in accordance with the previous regression, is pivotal to understanding what motivates action from corporations. While awareness drives the perception of risk, only opportunity has been statistically proven to drive sustainable action. There appears to be a missing link between awareness and action that occurs in the transition of perception of externalities as opportunities to gain competitive advantage, rather than as risks to be managed. The graph of this relationship is displayed in Figure 17.Continued on Next Page » From the Inquiries Journal Blog ")  Related ReadingJournalQuest is a free program to help academic student publications increase online readership and distribution. If you are interested in enrolling a journal at your school, please visit the JournalQuest website. Monthly Newsletter SignupThe newsletter highlights recent selections from the journal and useful tips from our blog. Suggested Reading from Inquiries Journal
Inquiries Journal provides undergraduate and graduate students around the world a platform for the wide dissemination of academic work over a range of core disciplines. Representing the work of students from hundreds of institutions around the globe, Inquiries Journal's large database of academic articles is completely free. Learn more | Blog | Submit Follow IJ
Latest in Economics |