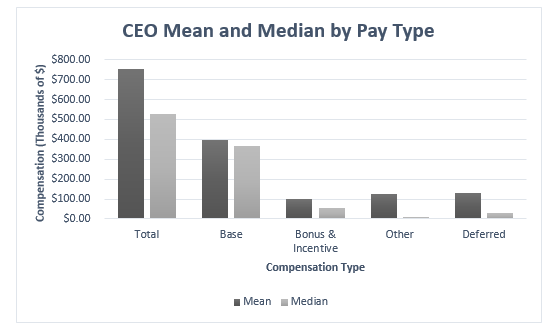
From The Developing Economist VOL. 3 NO. 1Executive Compensation at Credit UnionsIV. Descriptive StatisticsFigure 1 shows the mean and median for CEOs by pay type:
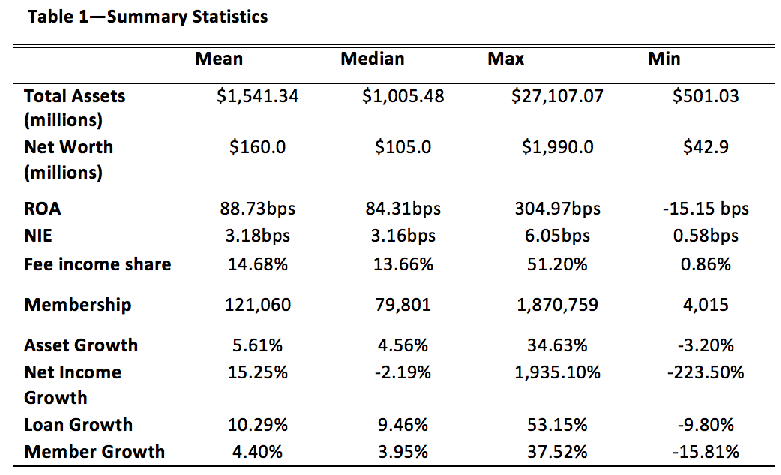
Figure 1 - CEO Mean and Median by Pay Type Definitions for pay type were taken from IRS Form 990 instructions. Total compensation is defined as the sum of base, bonus, other and deferred compensation. Base compensation is made up of primarily salary, but also 401k deferrals and health benefit plans. Any bonuses or compensation given out as incentive pay falls under bonus compensation. Severance or change of control payments, tax gross-ups, vacation/sick leave, life insurance, and goods or services provided (legal, housing, travel, etc.) are all classified as other compensation. Finally, deferred compensation is any income deferred that is not taxable in the current period. Mean and median total compensation for CEOs in the sample were $761,257 and $530,171, respectively. Base compensation had a mean of $400,601 and a median of $368,237. While the mean and median for bonus compensation came out to $100,835 and $58,493. As can be seen in Figure 1, base compensation accounts for a large share of CEO pay. Bonus compensation is the only other pay type with a median above $50,000. This study focuses on base compensation and bonus compensation because they are the most useful for learning about credit union compensation practices. Other and deferred compensation vary greatly between credit unions and over time within credit unions. Moreover, they are not associated with size or performance of the credit union. They are often payouts of retirement or other benefit plans that had been accumulating for a number of years. Total compensation is not examined because of the outsized in uence outlier values of other or deferred compensation may have on the data. Moving on to credit union characteristics, table 1 provides the mean, median, maximum, and minimum values for the characteristics examined in equations (1)-(3).
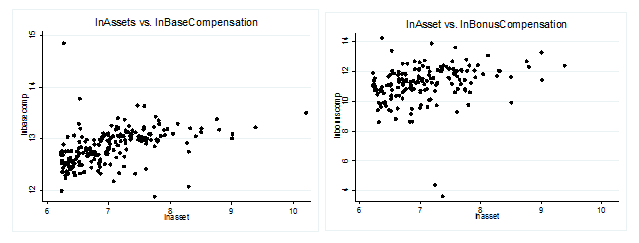
The median credit union in the sample has approximately $1 billion in assets and 80,000 members. One surprising statistic presented in the table is that median net income growth fell by over 2%, yet the mean was positive. Lastly, and unsurprisingly, base compensation and bonus compensation are very well correlated with asset size. Figure 2 shows the log of assets plotted against the natural logs of base compensation and bonus compensation, respectively. The Rvalue of log assets vs. log base compensation is 0.44, while the R-value of log assets vs. log bonus is 0.267. To account for this stylized fact, I control for asset size for the rest of the study.
Figure 2 - Log of Assets vs. Log of Base Compensation Sample ComparisonTo ensure that the results found from the sample taken are applicable to credit unions that are not state chartered or are below $500 million in assets, I compare credit union characteristics of the sample to all state chartered credit unions, all nationally chartered credit unions, and nationally chartered credit unions above $500 million in assets. The results are displayed in table 2.
As shown in the table, credit unions with over $500 million in assets perform much differently than credit unions on the whole, particularly in key measures such as asset growth, loan growth, and return on average asset. This is unsurprising, and suggests that the results of this study are only applicable to credit unions with over $500 million in assets. As for the comparison between federal and state credit unions with over $500 million in assets, the characteristics are quite similar. Noteworthy differences occur between loan growth and return on average asset, but particularly striking is the difference in dividend yields. In 2013, federally chartered credit unions provided 0.54% dividend yields, while the same number for state chartered credit unions was just 0.31%. These divergences do not necessarily reduce the saliency of the study, but should be kept in mind when the results are presented. Beyond comparing credit union characteristics of the sample to all credit unions, it is useful to compare compensation characteristics of the sample to industry survey and banking sector data. Such a comparison is made below in figures 3.1 and 3.2.
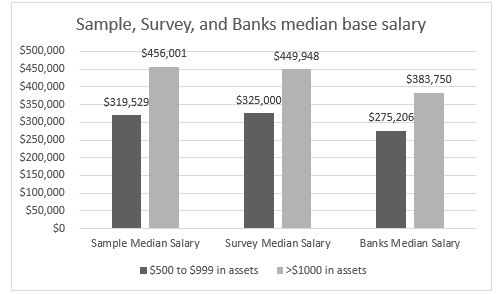
Figure 3.1 - Sample, Survey, and Bank median base salary
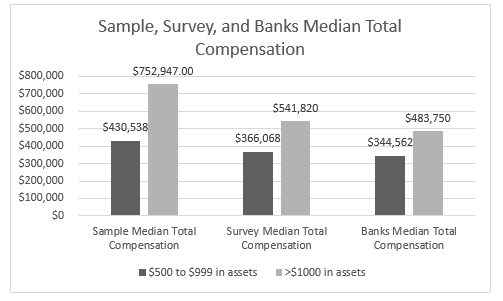
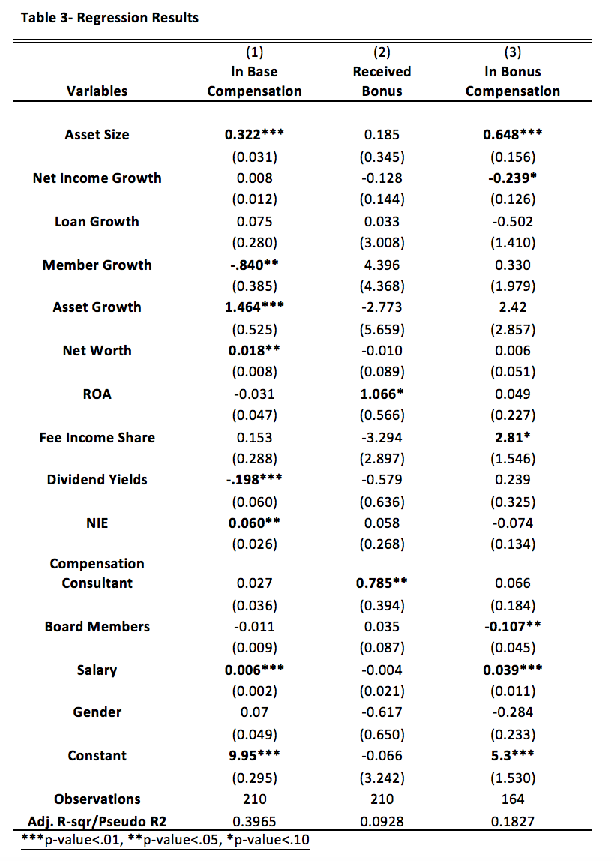
Figure 3.2 - Sample, Survey, and Bank median total compensation The survey I use was conducted by the Credit Union Executives Society in 2013. They polled 443 credit unions, 427 of which provided compensation information for their CEO. The information on bank salary comes from the Independent Community Bankers of America and American Bankers Association compensation surveys. Results for median salary (or base compensation) between my sample and the survey are remarkably similar. My sample of credit unions with assets between $500 and $999 million in assets has a median base compensation of $319,529, while the median for my sample of credit unions with over $1 billion in assets is $456,001. In comparison, the credit unions from the survey with $500 to $999 million in assets had $325,000 and the credit unions from the survey with over $1 billion have a median of $449,948. Such similarity suggests that the sample represents executive compensation for all credit unions over $500 million well. The difference between credit union base compensation and bank base compensation is also notable. Credit union CEOs appear to make about 15-20% more in base compensation than bank CEOs. A comparison of total compensation is also provided, however an important caveat must be made regarding the total compensation statistics. What is defined as total compensation for the sample is different than the definition for the surveys. In the sample, total compensation is all compensation received, while in the surveys total compensation only includes cash compensation and excludes benefits, long-term incentives like stock options, and perquisites. This explains why the sample has a much greater total compensation than the survey and can also be used to illustrate the amount of non-cash compensation credit union CEOs receive. Additionally, it should be noted that bank CEOs receive a much greater proportion of their compensation in forms that would not be included in the survey and so a comparison between the sample total compensation and survey bank total compensation is not suitable. V. Results & AnalysisThe results to equations (1)-(3) are given in table 3:
For the equation measuring base compensation, the results are in line with expectations for the performance variables, but a surprising trend is found for the member services variables. A number of performance variables are positive and significant in the regression for base compensation, including asset growth, net worth, and non-interest expenditures as a share of total assets. Asset growth has the most economically significant coefficient, as a 1.46 percentage point increase in asset growth is associated with a 1% increase in base compensation. Strikingly, the variables capturing member services are negative and significant. The coefficient for member growth is -.840, indicating that a .84 percentage point decrease in the number of members in a credit union will lead to a 1% increase in the CEO's base compensation. Moreover, dividend yields is also negatively related to base compensation, suggesting that the less a credit union pays its members in dividends, the more it will pay its CEO. As for the miscellaneous variables, only the control variables total assets and salary are significant. On the whole, the model developed for base compensation has strong explanatory power, as the adjusted r-squared equals .3965. In contrast to the base compensation regression, the logit regression for whether a CEO received bonus compensation is not explained well by the independent variables. Only two of the variables included in the regression are significant and the pseudo R2 is only .0928. Interestingly, however, the use of a compensation consultant is one of the significant variables, which is consistent with the literature on executive compensation. Finally, the equation measuring the bonus compensation contains some interesting findings as well. First, the share of income a credit union receives from fees in positively related to the amount of bonus compensation a CEO receives. This implies that the more credit unions charge their members for services, the bigger bonus a CEO receives. The result is similar to what was found in equation (1), that CEO's are disincentivized from prioritizing member services. Another fascinating result is that the size of a credit union's board is negatively related to the bonus pay of a CEO. This result is consistent with the literature on nonprofit executive compensation. Lastly, one perplexing result is that net income growth has a negative relationship with the size of a CEO's bonus. Net income growth is a fairly generic performance indicator so it is difficult to find a story that fits why this may be the case. In comparison to the results of those found in the literature for for-profit financial institutions and non-profit firms, the results for credit union executive compensation more closely match up to for-profit financial institutions. The results of the model suggest that in credit unions, executive compensation is primarily determined by financial performance indicators, which is the main determinant in for-profit financial institutions. Further, there is no evidence that credit unions incentivize member services, while in the non-profit literature the organization's social mission usually plays a central role in executive compensation. It must be noted, however, that the relationships implied by the results are very tenuous and should be taken with a great deal of caution. First, the sample size of the study limits how confident we can be in the significance and magnitude of the relationships observed. Further, since we cannot safely assume that the independent variables are exogenous, we can only establish correlation and not causation. VI. ConclusionThis study is the first to examine credit union executive pay using compensation information from IRS Form 990. I use OLS and logistic regression analysis to identify the determinants of base compensation, examine what factors lead to credit union CEOs receiving bonuses, and study the incentives credit unions place on their CEOs using bonus compensation. For base compensation, the results suggests that credit unions incentivize financial performance at the expense of member services. The evidence for bonus compensation somewhat supports what is found in equation (1), as fee income share is negatively related to bonus compensation. Board size also appears to have a large impact on the bonus a CEO receives. Finally, factors that determine if a CEO gets a bonus are return on average asset and the use of a compensation consultant. The findings from this study help to illustrate what credit unions use to determine executive compensation and how that affects the incentives placed on credit union CEOs. Moving forward, the most obvious way to expand on the study of credit union executive compensation would be to include time series data into the sample. Including time series data would highlight any industry trends in executive compensation and help control for idiosyncrasies in compensation practices among firms that cannot be identified with a single year of data. Additionally, the size of the dataset could be expanded to include state credit unions with under $500 million in assets. References
Endnotes
This article was published in A publication of University of Texas at Austin 
From the Inquiries Journal Blog   Related ReadingJournalQuest is a free program to help academic student publications increase online readership and distribution. If you are interested in enrolling a journal at your school, please visit the JournalQuest website. Monthly Newsletter SignupThe newsletter highlights recent selections from the journal and useful tips from our blog. Suggested Reading from Inquiries Journal
Inquiries Journal provides undergraduate and graduate students around the world a platform for the wide dissemination of academic work over a range of core disciplines. Representing the work of students from hundreds of institutions around the globe, Inquiries Journal's large database of academic articles is completely free. Learn more | Blog | Submit Follow IJ
Latest in Economics |