From The Developing Economist VOL. 3 NO. 1The Effect of a 311 Vacant Building Call on Crime Rates
IN THIS ARTICLE
KEYWORDS
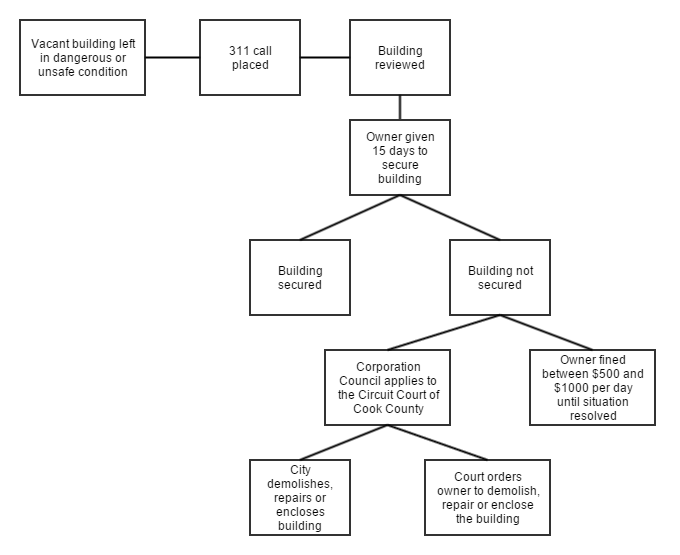
AbstractIt is generally accepted among researchers that incidence of crime is on average higher around vacant and abandoned properties because they can serve as safe havens for criminal activity. However, there has been little research investigating the effect of government intervention to rehabilitate vacant and abandoned properties on crime rates. We examine whether crime is reduced in Chicago near vacant and abandoned buildings after the city receives a service request call notifying them that the building is vacant. We find that reduction in crime is minimal following a service request. I. IntroductionAbandoned and vacant properties have long been a source of economic and political debate in the United States. Historically, property abandonment has been considered a symptom of urban disinvestment and not a cause. However in recent years, many studies have investigated whether there is a casual link between vacant buildings and the crime rate in the surrounding areas. Since these spaces offer an area of low supervision, they can act as a haven to individuals with criminal intent. Consequently, these buildings if left unsecured often evidence acts of prostitution, drug use, and gang-related activities. This paper seeks to investigate the relationship between a 311 call reporting a vacant building in the Chicago area and any following reduction in the level of crime. Specifically we are interested in the presence of any decrease in crime near a vacant building once the city government becomes aware of its presence and can induce rehabilitation. We make use of crime and property data from the City of Chicago data portal, demographic data from the American Community Survey, and weather data from the National Climatic Data Center. We use the first difference estimator to address the problem of omitted variable bias. This paper analyzes the outcome of the regression, the implication of the findings, and potential policy relevance. The subsections of the paper are broken down in the following manner. Section II is dedicated to a review of relevant literature. Section III describes the process that follows a 311 call reporting a vacant property in Chicago. Section IV addresses the issue of why our contribution is relevant. Section V describes our empirical approach and model. Section VI provides an explanation of the obtained results. Section VII analyzes our findings. Finally, Section VIII offers some concluding remarks on the topic. II. Literature ReviewA substantial body of literature suggests that the presence of vacant properties induces greater crime in a region. One popular justification for this is the "broken window theory," which asserts that signs of abandonment and disorder encourage further disorder (Kelling and Wilson 1982). An alternative argument with considerable supporting research is rational choice theory, which holds that vacant properties reduce the risks and costs of illegal activity for a prospective criminal since they offer privacy and low supervision (Clarke 1995). To assess the affect of vacant property rehabilitation on crime rates, our paper mainly draws upon Spelman's 1993 paper "Abandoned Buildings: Magnets for Crime?" and Branas, Rubin and Guo's 2012 paper "Vacant Properties and Violence in Neighborhoods." The premise for our paper relies upon their evidence that vacant and abandoned properties are a significant driver of crime in urban neighborhoods. In addition, we draw on their conclusions that government responses to these properties can result in a tangible reduction in crime. Spelman compares blocks with and without open abandoned buildings in a low-income Austin, Texas neighborhood using a matched pairs design. His results showed that crime rates on blocks with open abandoned buildings were twice as high as rates on similar blocks without open buildings. He argues that reverse causality is not a factor since the majority of vacant building owners are absentee landlords rather than residents. Finally, he states that 85% of housing inspections in this dataset were conducted as a result of citizens' complaints, and that only 15% were conducted by an inspector on his or her own initiative. However, Spelman's experiment design could have been liable to overmatching and thus statistical bias. Furthermore, as he only included one Austin neighborhood in his work it is dubious that the results can be generalized. Branas, Rubin, and Guo extend this direction of inquiry and show that increasing levels of vacancy were associated with increased risk of assaultive violence in urban block groups. They achieve this by using a study sample of 1816 block groups in Philadelphia County. A census block group is a smaller geographic unit than a census tract and in their dataset the average block group was 0.07 square miles. The researchers then compiled and linked aggravated assault and vacant property data between 2002 and 2006. Finally, they produced their results by using a mixed effects negative binomial regression model in order to show increasing levels of crime in the presence of vacant buildings. Cui shows in a study of vacant properties and foreclosures in Pittsburgh that this effect is fairly localized, with crime 15% higher within 250 feet of a property than it is between 250 and 353 feet. He also argues that the longer periods of vacancy have a greater effect on crime rates (Cui 2010). This previous academic literature has linked abandoned buildings to the crime rate in the surrounding area. However, there is a significant lack of work investigating the effectiveness of any governmental response to vacant buildings. In this paper we aim to use empirical evidence and techniques to explore this question thoroughly in the Chicago area. If the Chicago Department of Buildings is effective in its response to vacant properties, we can expect to see a statistically significant decrease in the surrounding areas' crime rates after a 311 call. This is particularly relevant to policy discussions because past research indicates that displacement of crime is likely limited following reductions in opportunity; indeed, there may be more general benefits of crime reduction through displacement through a "multiplier" or "halo" effect (Gabor 1990; Clarke and Weisburd 1994; Weisburd et.al. 2006). Succesful rehabilitation also has the potential to boost property values, which Han shows diminish in the presence of vacant buildings at an increasing magnitude and in a growing geographic region over time (Han 2013). If building rehabilitation is successful, then there will likely be substantial benefits to the community both around the vacant property and in surrounding areas. III. Inspection and Rehabilitation Process After a 311 CallThe diagram below shows the process that takes place when a 311 call is placed to report a vacant property in Chicago. First, the building is assessed by a city housing inspector. If the building is deemed in violation of the State Housing Code, the Chicago Building Department sends a notice directing the owner to put the building in a safe and secure condition within 15 days. In the case where the owner cannot be identified, the government sends the notice to the person or persons in whose name the building was last assessed. If the building is not secured within the time limit the Corporation Council applies to the Circuit Court of Cook County for an order that either authorizes the city to demolish, repair, or enclose the property, or requires the owner to do so. Furthermore if the process gets to this stage, the owner is fined between $200 and $1000 per day, for each day from the 16th day until the building is secured or demolished. All costs for the demolition, repair or enclosure of the building are recovered from the owner of the property. Consequently, we can see that the process regarding a 311 call is strict, and the financial penalties can grow extremely quickly past the 16th day. As such, there is a strong incentive for the building owner to quickly secure the building if they receive a notice from the Chicago Building Department (Chicago Code 13-12-125).
Figure 1: This diagram depicts the process of inspection and rehabilitation following a 311 call. IV. Relevance of our ContributionAs already stated there is a significant lack of academic literature addressing the effectiveness of the governmental response to a vacant or abandoned building service call. Our paper aims to provide a first step in solving this paucity. However, it must be noted that the reader should be hesitant in generalizing our results for two reasons. First, since government response to a vacant properties is dealt with by localities who base their practices on State Building Codes the methods practiced by the Chicago departments may differ from other departments around the country. Furthermore, there is a selection bias issue in regards to 311 calls. It is likely that a civilian will only report a vacant property if it is imposing significant costs on the local community, e.g. crime. This has implications on the interpretation of our findings. In particular we expect crime rates to be higher than average in the time period preceding a service call than it would be for the typical vacant or abandoned property. The effects we observe should be understood as the change in crime around vacant buildings where crime is more likely to already be prevalent. V. Model and MethodologyIn this section we describe a model of the difference in crime rates from the time period before a 311 call is made to the time period after the call is made in some small region around the abandoned property. We estimate the model's parameters using the city of Chicago's crime records from 2010 to the present, block level demographics form the American Community Survey, and temperature data from the National Climatic Data Center. Using these estimates we quantify how much crime is reduced after a 311 call is made. Description of ModelWe consider the crime rate around an abandoned property in a given period of time. We model this as:
where yi, t is the crime rate around abandoned building i over time period t. Di, t is an indicator for whether the time period is post-call or pre-call. X is a vector of controls that remain fixed between the pre-call period and the post-call period. (Q × Di, t) is a vector of interaction terms describing the difference in the effect of some control variables in the pre-call period and the post-call period, and Ri, t is a vector of controls that evolve over time. ηi contains unobserved characteristics that affect the crime rate and remain fixed over time. If the components of ηi are correlated with values controlled for in the regression then the results of simply running a pooled regression of the pre-call crime rates and post-call crime rates would be susceptible to omitted variable bias. There is sufficient theoretical justification to suggest such correlation might exist; for instance, among the control variables in our regression is whether the building is boarded at the time the service call is made. There is reasonable justification to argue this could be correlated with fixed unobserved determinants of crime in the surrounding region. To account for this, we use a first differences regression. Let time t correspond to the pre-call period and time t+1 correspond to the post-call period. We seek to measure yi, t+1 - yi, t, the difference in crime rate between the two periods. Set
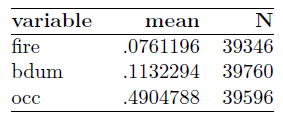
βTX cancels out upon taking differences because it remains fixed between periods. γ measures the mean difference in crime rate after accounting for controls; if γ is negative this suggests crime rates decrease after the vacant building service call is made. αT measures the effect of time-fixed variables on the difference in crime rates between periods, and λT measures the effect of the difference in time-varying variables on the change in crime rates. We now discuss the components of the model further. The constant term, γThe constant term measures the mean difference in crime rates after accounting for controls. We expect this term to be negative based on the literature. After a service call is made, an inspector is sent to the property, and the city has a right to force the building owner to board up or repair the property if it does not abide by housing codes. The city can also demolish the property under certain circumstances. Spelman argues that secured vacant buildings pose little to no greater risk than non-vacant buildings, so succesful rehabilitation should lead to a reduction in crime rates (Spelman 1993). Variables included in QThese variables effect the difference in crime rates but remain fixed over time. We include demographic characteristics, whether the property is boarded, whether it is occupied, whether the building is vacant due to fire, the police district to which the property belongs, and the number of housing units on the block. Demographics and Number of Housing UnitsDemographics included in our model are the median income, population, percentage of black residents, and percentage of females in the region surrounding the vacant property. The effect of each of these variables is theoretically ambiguous. The sign for median income, for instance, can reasonably be either positive or negative. It is perhaps possible that owners of vacant buildings in high-income areas will be more likely to carry out rehabilitation demanded by the city in a timely manner, or the opposite could be true if costs of rehabilitation are higher. Similarly the effect of the other demographics included in the model and the number of housing units is difficult to determine theoretically. Whether the Property is BoardedAs the previously mentioned literature suggests, properties that are boarded do not seem to exhibit more crime than nonvacant properties. As a result we expect properties that are not boarded before an inspection is made to have a higher reduction in crime rate because the effects of rehabilitation should be greater. Whether the Property is OccupiedWe control for whether the vacant property is occupied at the time of the service call by gangs, children, homeless, or other individuals. We expect occupied properties will have a higher reduction in crime rate because these individuals will be dispersed by property rehabilitation, eliminating their safe haven for crime. Whether the Property is Vacant Due to FireThe change in the crime rate given that the property is vacant due to fire is ambiguous. It could be that the change will be smaller because it is more unlikely that the caller was prompted to notify the city because of higher crime in the time preceding the call. Crime rates might be higher in the region after the call is made because the block is in greater disorder, or the causation could act in the opposite direction; greater disorder leads to higher risk of fire. There is literature that suggests the latter is the case (Socioeconomic Factors and the Incidence of Fire 1997). Police DistrictWe include dummy variables for each police district in Chicago to determine if there is a difference in the reduction in crime rates across districts. The signs of these variables are theoretically ambiguous. Variables Included in Ri, tRi, t includes variables that change between the time period before the service call and the time period after the call is made. We include the difference in mean temperature between the time periods and the difference in total crime within the community area the vacant property belongs to. Difference in Mean TemperatureResearch suggests that temperature has a positive effect on crime rates because people spend more time outside of home, increasing the risk of criminal victimization (Field 1992). As a result we expect increasing the difference in temperature will lead to an increase in the difference in crime rates. Difference in Total Crime within the Community AreaControlling for the difference in total crime within the community area a property belongs to accounts for the effect of trends in crime within the community as a whole. We expect an increase in the difference in crime at the community level leads to an increase in the difference in crime around a vacant property. We discuss characteristics of a community area further in the following section. VI. DataWe retrieved data on 311 vacant or abandoned property service calls from the city of Chicago's data portal. The data set contains up-to-date records of all calls dating back to January 1, 2010. At the time of our retrieval of the data in early March there were approximately 48000 data points. Relevant columns included in the data set are the date the request was received, the location of the building on the lot, whether the building is open or boarded, where the entry point is if it is open, whether the building is vacant due to fire, whether anyone is using it, its address, zip code, police district, community area, and latitude and longitude. We discuss some of these variables further in the context of our model, but we first note some important characteristics of how the data is collected. As mentioned in Section IV, there is a selection bias in whether a 311 call is made. Individuals are more likely to notify the city of a vacant property if its existence has a tangible negative impact on the community, for instance by being a safe haven for criminal activity. The effects we observe should be understood as the change in crime around vacant buildings where crime is more likely to already be prevalent. While this distinction is important, the policy implications of our analysis remain. In particular, our results will determine if rehabilitation by the city leads to lower crime rates near properties where rehabilitation is especially necessary. The differences will likely be in greater in magnitude than they would be absent the selection bias, however. It is also worth noting that according to Spelman 85% of housing inspections in Austin were conducted after a complaint had been filed by a citizen and 15% had been conducted by an inspector on their own initiative (Spelman 1993). This would suggest that inspections resulting from service calls are largely representative of the total number of inspections, but this may have changed considerably over time. Property tax delinquency has been recognized as highly correlated with vacancy and is increasingly being used to identify vacant and abandoned properties (Alexander and Powell, 2011). There appears to be a pattern in when service calls are made by month. A greater number of calls are made in summer months than in winter months. This is likely because the negative effects of a vacant property are more apparent in the summer, when crime tends to be higher. Figure 1 in the appendix shows a bar plot of service calls by month over the course of our study.This chart also shows that there is considerable variance in service calls by month. These patterns demonstrate the importance of including community-wide effects in our model. Since the number of service calls is not roughly uniform by month, not accounting for these trends in crime can skew results because crime in the pre-call period may be systematically different than crime in the post-call period for reasons unrelated to a 311 call being placed. We do not currently include the location of the entry point for open houses in our regression because it is coded as a string variable and is difficult to categorize systematically. This could be an area for further research. Table 1 presents summary statistics for whether the property is boarded, whether it is being used, and whether it is vacant due to fire. Note that there are a substantial number of missing values between the three variables. In our regressions these missing values reduce our sample size by several thousand.
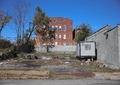
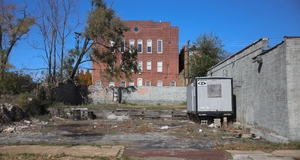
Table 1: Property Characteristics Two other variables with important implications in our regression are the police district and community area to which the property belongs. We test for differences across different police districts on the difference in crimes between the pre-call period and the post-call period. Figure 2 is a map of community areas and police districts obtained from the city of Chicago. Community areas are groupings of neighborhoods with relatively homogeneous social characteristics. These demarcations were defined in the 1920s and have remained largely static over time. We control for the total number of crimes that occur in the community area over the relevant time periods, as described previously. Estimating Crime RatesIn order to estimate crime rates we use a method similar to Spelman (Spelman 1993). We compute the number of total crimes in a square of side length 800ft centered around the vacant property for a 90 day time period before and after the service call is made. A 90 day window allows for ample time for the city to inspect and recommend rehabilitation for a property. We exclude 120 days from each endpoint of the sample in order to be able to compute the pre-call and post-call crime rates for each service call. This reduces our sample size to about 45000 calls. We use square boundaries instead of circular boundaries because we believe this better captures the block structure of neighborhoods and because it was computationally simpler. Our method can also be interpreted as a timeand spatially-varying Poisson model with boxcar kernels in both dimensions. Our crime data comes from the City of Chicago's crime records, available through the Chicago data portal. Crimes include burglary, sexual assault, arson, weapons violations, drug-related crimes, homicide, and many others. Note that the crime statistics do not include cases of domestic violence. Figure 3 displays the size of the region surrounding the vacant building over which we compute crime rates. Figures 4 and 5 display density estimates of the crimes and service calls across Chicago respectively. We note that service calls are far more concentrated in pockets of the city, particularly the south and west sides of the city. Though not evident in the density plot, there are service calls across the entire city, but the number of calls in the downtown area and north side are so small relative to the other regions that they have little density on the map. This could be because of differences in social and economic characteristics of the regions or because service calls are less likely to be made on apartment buildings, which are more concentrated in the regions with little density. A comparison of these maps mirrors the results of Branas, Rubin and Guo. The number of service requests appears to be highly correlated with incidences of crime (Branas et. al., 2012).
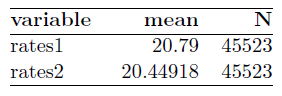
Table 2: Crime Around Vacant Buildings Table 2 shows summary statistics for the number of crimes in the region surrounding a vacant property in the periods before and after the service call is made. Note that the mean crime rates are similar, with the crime rate in the period before the call slightly greater.
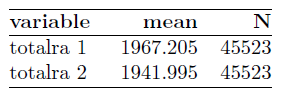
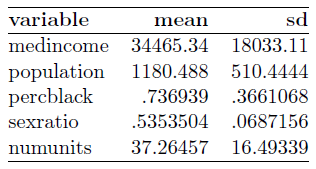
Table 3: Crime Rates in Community Area Table 3 displays the mean crime rate in the periods before and after a service call is made in the community area. Temperature, Demographics, and, Number of Housing UnitsDemographics and the number of housing units are taken from 5-year American Community Survey estimates from 2013 at the census block group level. Census block groups are the smallest geographical units for which the bureau publishes sample data. Typically block groups have a population of 600 to 3000 people. This allows them to capture effects that are appropriately local to the regions we constructed around vacant buildings.
Table 4: Demographics Around Vacant Buildings Table 4 shows summary statistics for variables taken from the ACS across the locations of the vacant properties. Temperature data is obtained from the National Climatic Data Center. We retrieved the mean daily temperature in degrees Celsius as measured at Chicago Midway Airport for each day in our sample and computed running averages of the temperature in the 90 day period before and after the service call.
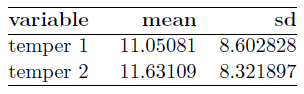
Table 5: Temperature in pre-call and post-call periods Table 5 shows summary statistics for the mean temperature in the pre-call and post-call periods. Note that the mean temperature in the post-call period is roughly the same as the mean temperature in the pre-call period.Continued on Next Page » This article was published in A publication of University of Texas at Austin 
From the Inquiries Journal Blog")   Related ReadingJournalQuest is a free program to help academic student publications increase online readership and distribution. If you are interested in enrolling a journal at your school, please visit the JournalQuest website. Monthly Newsletter SignupThe newsletter highlights recent selections from the journal and useful tips from our blog. Suggested Reading from Inquiries Journal
Inquiries Journal provides undergraduate and graduate students around the world a platform for the wide dissemination of academic work over a range of core disciplines. Representing the work of students from hundreds of institutions around the globe, Inquiries Journal's large database of academic articles is completely free. Learn more | Blog | Submit Follow IJ
Latest in Criminology & Criminal Justice |