From The Developing Economist VOL. 2 NO. 1Value-Added Real Effective Exchange Rates: Testing for Countries with High and Low Vertical Specialization in TradeIV. DataGerman and Belgian quarterly export data were drawn from the IMF's Direction of Trade Statistics (DOTS). As a proxy for quarterly world income, I use the aggregate real GDP of the select OECD members for which quarterly real GDP data are available over the entire period: Belgium, France, Finland, Germany, Norway, South Korea, Spain, Switzerland, the United Kingdom, and the United States.53 The real GDP data for these countries were pulled from Global Insight's Key Indicators. For this paper, I manually constructed value-added and conventional REERs for both Belgium and Germany to ensure direct comparability. The REERs for Belgium and Germany are calculated using bilateral trade weights, nominal exchange rates, and relative price data for Belgium, Germany and their respective top trade partners. I define a "top trade partner" as any nation that accounted for at least 1 percent of the country's total imports or exports between 1980 and 2012. For each trade partner and home country, quarterly nominal exchange rate data were pulled from the IMF's International Financial Statistics (IFS) database. Beginning in 1999Q1 the exchange rates of Austria, Belgium, France, Germany, Italy, the Netherlands, and Spain switched to the euro exchange rate. Consumer price data came from the IMF's International Financial Statistics. However, due to fragmentation in the IFS German consumer price data, German consumer prices were collected from the OECD's Main Economic Indicators database. GDP deflator data for the countries above was drawn from the IMF's International Financial Statistics database using Global Insight. I constructed the Bayoumi bilateral trade weights using commodities and manufactures trade data from the UN COMTRADE database. The trade weights were calculated annually for each bilateral trade relationship using the following formula:54
Here, i denotes the home country (either Belgium or Germany) and j denotes the trade partner. αM and αC denote the overall shares of manufactures and commodities in global trade respectively, andW(M) andW(C) represent the partnerspecific weights for manufactures and commodities trade with the home country. The value-added and conventional REERs for Belgium and Germany were then constructed using the following method:55
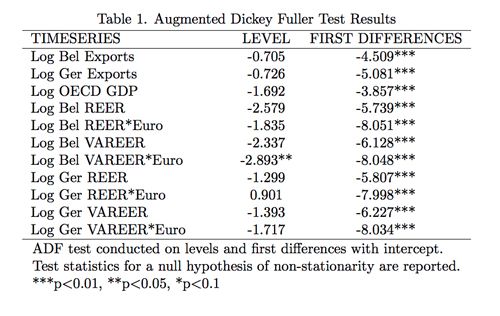
The REER index (or VAREER index) is the geometric sum of the individual bilateral exchange rates weighted by bilateral trade exposure as defined in equation (9). For each home country i and trade partner j, Pi and Pj denote price level (using GDP deflator for VAREERs and CPI for REERs). Ei and Ej denote the bilateral nominal exchange rates with the United States, and Wij denotes the bilateral trade weight for pair (i, j). The VAREER analyzed in this paper differs from that of Bems and Johnson in two ways. First, as previously mentioned, I use a quarterly VAREER index rather than the annual index constructed by Bems and Johnson. This is done to make the VAREER more conducive to econometric analysis; while Bems and Johnson would have been limited to 39 observations in a regression using annual VAREERs, this paper is able to analyze 130 observations each for Belgium and Germany. Second, I elect not to use the Bems and Johnson (2012) value-added trade weights in constructing the VAREER. This is done to simplify the construction of the VAREER and is justified by the conclusion of Bems and Johnson that valueadded trade weights do not account for the difference between the VAREER and REER.56 V. Results Because export, GDP, and exchange rate data are traditionally non-stationary series, I test the stationarity of the levels and first differences of each variable. Table 1 reports the results of the ADF tests.
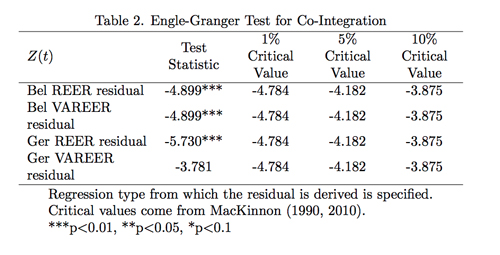
Table 1. Augmented Dickey Fuller Test results All of the variables tested except for the log of the Belgian VAREER-euro interaction term are identified as I(1) time series. This makes it possible to use the Engle-Granger twostep procedure to check for co-integration and construct an error-correction model that includes estimates for the longand short-run relationships. Table 2 shows the results of the Engle-Granger test for cointegration.57 The null hypothesis of residual non-stationarity is rejected when the test statistic exceeds the critical value. If the residuals are found to be stationary, then exports, OECD real GDP, and the relevant REER are co-integrated.
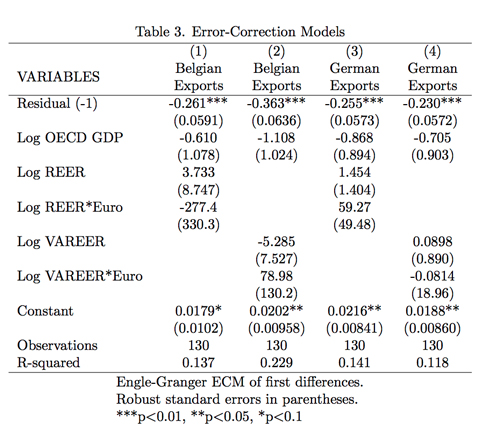
Table 2. Engle-Granger Test for Co-Integration These results reject the null hypothesis of no co-integration for the variables in both Belgian long-term export regressions and for the variables in the German VAREER regression. I fail to reject the null hypothesis of no co-integration for the German regression over the conventional REER; however, the test statistic falls less than 0.01 short of surpassing the 10 percent critical value. The presence of significant co-integration between the dependent and independent variables certainly justifies the inclusion of an error-correction model. The first difference of each country's exports is regressed over the lagged first differences of exports, OECD real GDP, the VAREER or REER, and the error-correction term (i.e., lagged residual). Regressing the ECM yields the results listed in Table 3.
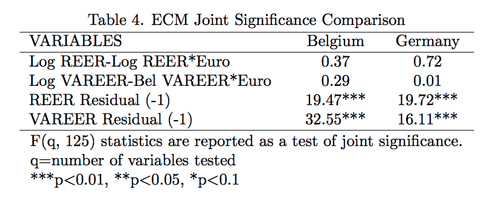
Table 3. Error-Correction Models At first glance, a few interesting characteristics of the regressions stand out. The first is that all of the error-correction terms achieve statistical significance, while none of the shortrun variables do so. The second is that the relative magnitude of the R-squared values exactly matches what would be predicted by the theory. The R-squared value of the Belgian export regression on the VAREER, 0.229, exceeds the R-squared value of the regression on the conventional REER, 0.137. Conversely, and as predicted, the R-squared value of the German export regression on the VAREER, 0.118, is exceeded by the R-squared value of the regression on the conventional REER, 0.141. This seems to favor the acceptance of the first conceptual hypothesis in the long-run. In terms of the second conceptual hypothesis, we also see that the R-squared value of the Belgian regression on the VAREER considerably exceeds the R-squared value of the German regression on the VAREER. Though these are separate regressions with different country data, these initial findings seem to support the second conceptual hypothesis that the VAREER will explain export demand variation better for Belgium, a country with high vertical specialization, than for Germany, a country with comparatively low vertical specialization. To further analyze the ECM results, I conduct joint significance tests on the short-run value-added and conventional REER measures for each country, as well as on the errorcorrection terms representing the significance of the long-run relationships, and compare the results to test the first hypothesis. The results are found below in Table 4.
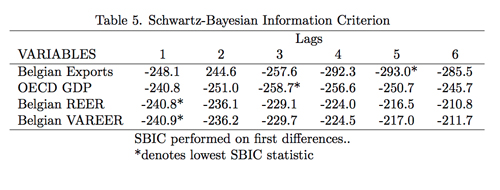
Table 4. ECM Joint Significance Comparison The joint significance results from the ECM further corroborate the accuracy of the theoretical predictions with regards to the long-run relationship. While the long-run formulations of Hypotheses 1a-1d are all rejected under these conditions (whereas it was predicted that Hypothesis 1b and Hypothesis 1c would fail to be rejected) this failure can primarily be attributed to the stringent conditions that had to be imposed by necessity (since F-statistics have no standard error and as such no formal test for direct comparison of F-statistics between regressions of this type exists). However, an examination of the relative size of the F-statistics of the error-correction term for each regression yields observations consistent with the theoretical predictions of both conceptual hypotheses. The F-statistic of the Belgian VAREER exceeds the F-statistics for both the German VAREER and the Belgian conventional REER considerably. Furthermore, the F-statistics of the German conventional REER exceeds the F-statistic of the German VAREER. These results appear to strongly suggest that, at least in the long-run, the VAREER explains changes in export demand better than the conventional REER for countries with high vertical specialization. However, the short-run variables in the regressions are clearly not significant, and the p-values that correspond to several of their joint distributions approach 1. Part of the lack of significance may be due to the fact that the Engle-Granger ECM does not allow for optimal lag selection, and thus is less accurate an estimator of short-run effects than other models. As a solution, I estimate an ARDL model with optimal lags selected using the Schwartz-Bayesian information criterion. I also estimate a short-run fixed effects panel regression model to test H2a and H2b, since it is difficult to make confident statements about the second conceptual hypothesis through the ECM, as one must also account for any time-invariant cross-country differences that may be having an additional effect on the relative explanatory power of the German and Belgian regressions. Given the non-stationarity of the levels of the log variables of interest, I estimate the ARDL using the stationary first differences of Belgian and German exports, OECD real GDP for select countries, and either the value-added or conventional REER for each respective country, where appropriate. To determine the optimal number of lags for each variable in the ARDL model, I apply the Schwartz-Bayesian information criterion for each of the first-differenced log variables, regressing exports on lags of itself and each of the independent variables. I choose to conduct the process for Belgium alone for ease of direct comparison of the models. This is justified since the German time series have similar characteristics. Table 5 reports the results of the Schwartz Bayesian Criterion lag selection.
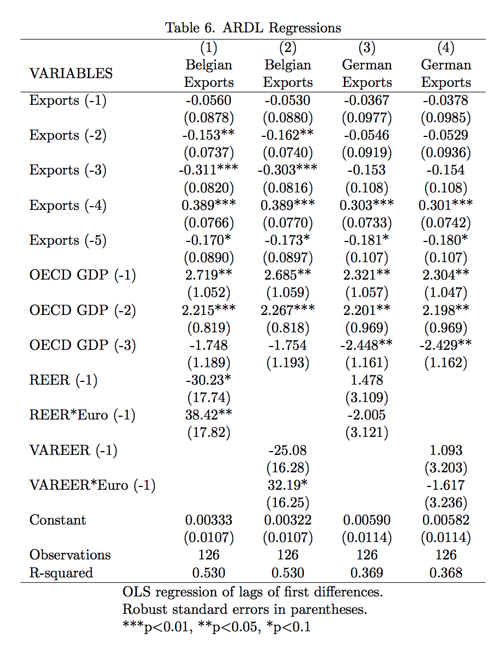
Table 5. Schwartz-Bayesian Information Criterion In line with the results in Table 5, I regress an ARDL(5,3,1,1) for each of the four REER measures and compare the Fstatistics as prescribed by the hypothesis tests in Section 3.2. Table 6 shows the results of the ARDL regressions.
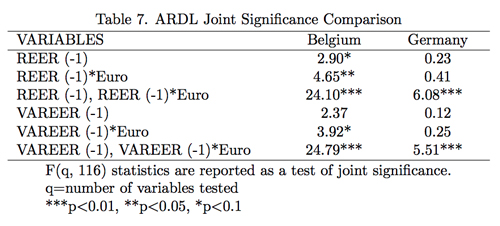
Table 6. ARDL Regressions A few characteristics of the regressions are noticeable at first glance from the output. Namely, we see that the Rsquared values of the Belgian regressions are essentially the same, at .530, truncated at the thousandths place. Likewise, the R-squared values for the German regressions differ only by .001. However, the R-squared values are substantially lower than those of the Belgian regressions. This indicates that there may be a time-invariant difference between the two countries for which the ARDL model does not control. Thus, the addition of a panel regression analysis will be beneficial. Using the regression output in Table 6, I compare the joint significance of the variables to test Hypotheses 1a-d. The results of the F-tests are found in Table 7.
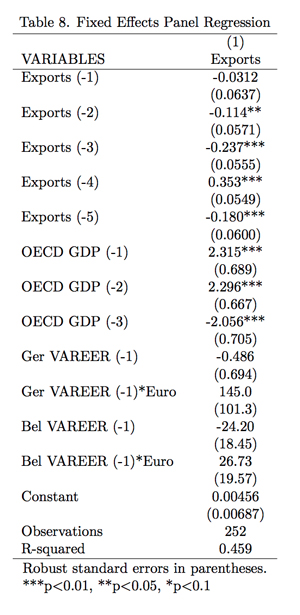
Table 7. ARDL Joint Significance Comparison It is immediately clear that the joint significance tests reject all four of the short-run sub-hypotheses, as opposed to rejecting only H1a and H1d, as the theory suggested. Thus, the ARDL analysis is not in a position to completely endorse the suitability of the VAREER as a replacement for the conventional REER for countries with high vertical specialization, though much of the reason why, again, is due to the lack of systematic means of comparing different F-statistics across regressions. However, as was also true with the ECM, the magnitude of the F-statistics are, in every case, consistent with the expectations of the theory. In the Belgian regression, the joint significance of the VAREER, with an F-statistic of 24.79, is greater than the joint significance of the REER, at 24.10. Likewise, in the German regression, the joint significance of the VAREER is less than the REER, at 5.51 and 6.08 significance respectively. One should note that these differences in magnitude are much smaller than the corresponding long-run differences, which were pronounced. Nevertheless, the relative sizes of the F-statistics do support the theory. The size of the spread between the Belgian and German R-squared values and F-statistics, in addition to the need to test Hypotheses 2a-b, further necessitates the estimation of the fixed effects panel regression. Using the same lags as the ARDL model, I regress exports over OECD real GDP and the VAREER rates in a panel regression. An interaction term is included to distinguish between the Belgian and German VAREERs. Running the panel regression with fixed effects results in the output summarized in Table 8.
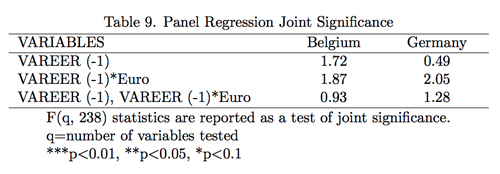
Table 8. Fixed Effects Panel Regression To address the validity of the null hypotheses, I calculate the joint significance of the German and Belgian VAREERs. The F-statistics for their joint distributions are summarized in Table 9.
Table 9. Panel Regression Joint Significance The panel regression yields F-statistics that contradict the joint significance results of the ARDL model. Not only are none of the VAREERs statistically significant, where it would be expected that at least the Belgian VAREER be, but the test statistic of the German VAREER, 1.28, exceeds that of the Belgian VAREER, at 0.93. The contradiction between the results of the panel regression and the theory-supporting results of the ARDL is certainly intriguing, especially since one might be inclined to believe that a fixed effects regression would improve the accuracy of the results. At the very least, since this panel regression is a short-run model, the results support the initial finding of statistical insignificance of the short-run relationship in the ECM. Thus, the panel results should cast doubt on the relative and absolute sizes of the joint significance test statistics in the ARDL model. But, importantly, the results do not directly contradict the findings of a significant long-run relationship in the ECM and actually corroborate the weakness of the short-run variables in the ECM.Continued on Next Page » This article was published in A publication of University of Texas at Austin 
From the Inquiries Journal Blog ")  Related ReadingJournalQuest is a free program to help academic student publications increase online readership and distribution. If you are interested in enrolling a journal at your school, please visit the JournalQuest website. Monthly Newsletter SignupThe newsletter highlights recent selections from the journal and useful tips from our blog. Suggested Reading from Inquiries Journal
Inquiries Journal provides undergraduate and graduate students around the world a platform for the wide dissemination of academic work over a range of core disciplines. Representing the work of students from hundreds of institutions around the globe, Inquiries Journal's large database of academic articles is completely free. Learn more | Blog | Submit Follow IJ
Latest in Economics |