From The Developing Economist VOL. 1 NO. 1The Effect of Crime on Achievement: The Differential Effect of Violent and Non-Violent Crimes on Achievement in High Schools
IN THIS ARTICLE
KEYWORDS
AbstractThis paper examines how the different forms of crime, violent and non-violent, affect the academic achievement of students scoring in the bottom 15% of standardized tests. Though funding for violent crime prevention may be justified based on the significant impact it has on students, our paper asks the question "can the same case be made to justify drug use prevention programs?" I. Introduction & BackgroundAccording to the Indicators of School Crime and Safety: 2010 report published by the National Center for Educational Statistics (NCES), there were approximately 1.2 million victims of non-fatal crimes within school bounds in 2008. Of these, there were 629,800 counts of simple assault, rape, robbery and other "violent" and "non-violent" crimes. These incidents have observable and noteworthy consequences; victims of crimes are known to avoid after school activities and certain locations at school, or skip class entirely all behaviors which impede a student's academic achievement (U.S. Department of Justice). In addition to the victims, the rest of the school body is harmed by an environment with crime as other students and teachers fear criminal actions against them (Hull 2000). In an effort to combat these issues, federal and state governments spend millions of dollars on crime prevention measures such as metal detectors, security forces, and additional training for staff. In the 20082009 school year, the New York City Department of Education, responsible for the largest school district in the United States, reported school expenditures of $287,384 on school safety services and $37,856 on drug prevention programs. Is this spending, however, efficient? This paper examines the relationships between crime and student achievement. In particular, we explore how crime may affect those students who score into the bottom 15% of standardized test scores. We focus on this population as it is the one of the groups that receives particular focus from the No Child Left Behind Act as well as being a direct benefactor of the crime prevention spending mentioned previously. As will be shown in the review of literature, the majority of previous studies focus on the negative impact of more dramatic, violent crimes. These large and negative impacts are often used to justify the funding of crime prevention programs. There is, however, less to no attention paid to non-violent offenses. In performing a quantitative analysis of violent and non-violent crimes, our paper contributes to the larger body of knowledge by studying the effect of non-violent crimes on student achievement. We confirm previous findings that violent crimes have significantly negative correlation with student achievement, thus providing additional evidence for justifying spending on violent crime preventions. Non-violent crimes, however, are found to have a statistically insignificant relationship with achievement, making funding for non-violent crime prevention programs less efficient from a student-impact viewpoint. We begin with a review of crime in schools in the current literature. We then present our data and regression model and results; this is followed by a discussion of our findings and possible policy implications. II. Review of LiteraturePast research has found that students affected by crime suffer academically (MacMillan and Hagan 2004; Wei and Williams 2004). These students also have poorer attendance rates (Ringwalt, Ennett, Johnson 2003). Additionally, criminal activity disrupts the general atmosphere of schools, negatively affecting staff and the greater community (Henry 2000). Henry (2000) also points out that school violence is an issue that cannot be viewed properly from a narrow perspective that examines only interpersonal violence; it is the result of many forces from both within and without the school grounds. Broader social issues, such as poverty, social exclusion, and economic inequality are major contributors to school violence (Kramer 2000). The qualities of the surrounding neighborhood, such as levels of crime and wealth, have also been found to affect school crime rates – and thus student achievement (Lee and Madyun 2009; Juvonan, Nishma, and Graham 2000). While these studies have found crime to adversely affect academics, they fail to distinguish between violent (shootings, armed robberies, etc.) and non-violent (drug and alcohol possession, vandalism, etc.) crimes, or focus solely on violent crimes. Our subsequent analysis explores this gap in the literature by explicitly comparing the differential impacts of violent and non-violent crime on students. III. Data SourceOur primary source of data for this study is "The School Survey on Crime and Safety" (SSOCS) as published by the National Center for Education Statistics. The SSOCS is a survey on over 3,500 public elementary and secondary schools, focusing on school crime, discipline, disorder, programs, and policies that ran on all even years except 2002 between 2000 and 2008. This data set is unique from others performed in the past because of its repeated observations on even numbered years; the study is currently processing its fifth set of data and allows us to track changes over time. This makes the SSOCS an excellent source of data while controlling for various time trends, allowing our analysis of crime to be more accurate than those using other data sets that do not divide crimes into specific categories. One concerning factor regarding this data set is that it is a repeated cross-section of the nation and is not longitudinal. Longitudinal data would allow us to remove time trends and examine the specific change in crime within schools due to policy changes. Consequently, we will only be looking at specific correlations between crimes and achievement. The nature of several elements in the survey also raises some concerns. The survey includes over thirty questions with multiple parts, but many are qualitative in nature, and responses could vary based upon how the responding principal feels on any given day, or if they recently had problems with specific areas addressed in the survey.
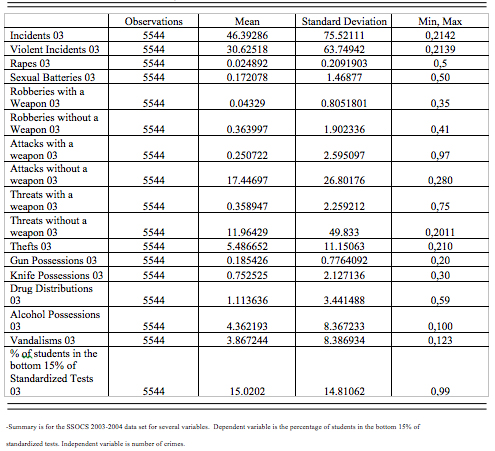
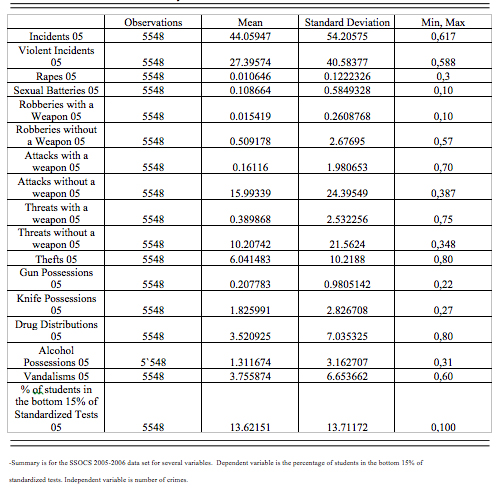
Figure 1: Table of Summary Statistics for the 2003-2004 Data Set We will control for this problem by focusing our analysis on the purely quantitative responses, and while some qualitative responses will be used (i.e. crime levels in districts), these will only be used when controlling for observable characteristics and will not be used directly in the analysis. Figure 1 (above) and Figure 2 (below) help to display the statistics that we preferred to work with, namely those consisting purely of records that can be checked against police reports. The most concerning data trend lies in the small number of reported rapes across schools, an average of 0.024892 and 0.010646 for the 2003 and 2005 surveys, respectively. We feel that this might invalidate some of the causal inferences that could be drawn from the regressions involving the variable, which we will address later on in the data analysis section. The other oddity lies in the variable threats with a weapon as the maximum value is a statistical outlier for one school in each time period.
Figure 2: Table of Summary Statistics for the 2005-2006 Data Set In addition, an examination of these school districts suggests that double-counting of crimes, between threats and possession of weapons, may have occurred. Lacking the ability to identify which schools may have contributed to this counting issue, however, we let the data remain and included it in our regressions. IV. ModelingTo demonstrate the difference between various types of crime, we present a regression model with gradually increasing controls across various observable characteristics in the hope of creating an accurate portrayal of the effect of crime on achievement of underperforming students nationwide. We will begin with a simple regression that looks only at the effect of violent and nonviolent crime on achievement. To proceed, we define A as the percent of students in the school who scored in the bottom 15% of standardized tests, for any given school district i and any given year m. We then define V, N as the number of violent and nonviolent incidents occurring at school i respectively. This yields the following model:
where the coefficient β1 represents the effect of violent crimes on the percent of students in the bottom 15% of testing. Similarly the coefficient β2 summarizes the effect of non-violent crimes on the same metric of achievement. By looking at these scores, as shown in Figure 3, we see that both coefficients are positive; crime has a negative effect on student achievement as there are more students scoring into the bottom 15% of test scores. By looking at a different year as shown in Figure 4, however, the effect of non-violent crimes becomes statistically insignificant while the coefficient for violent crimes remains strongly significant, possibly indicating the existence of some form of bias within the regression as we would expect the numbers to be similar when using data sets from adjacent periods. Note that these regressions lack controls intentionally because they represent a "first-look" at the statistics on crime, a place that we believe most policy-makers and/or school administrators would stop. In order to determine possible reasoning behind this strange change between the time periods, we will unpack the coefficients β1 and β2 into their respective crimes utilizing the empirical data provided in the survey. We hope that this will allow us to examine where the potential bias appears, so that we can specifically address it. We take β1 and estimate the separate effects of (Rapes, Sexual battery, Robberies with a weapon, Robberies without a weapon, Attacks with a weapon, Attacks without a weapon, Threats with a weapon, Threats without a weapon, Gun possession, Knife possession). Similarly, β2 separates into (Theft, Drug possession and distribution, Alcohol possession, Vandalism). This yields a new equation:
where δq,i,m is the specific crime q, for each school i and year m. Likewise μq represents the coefficient for each respective crime, displaying its effect on achievement. In a further attempt to maximize the validity of our data by removing omitted variable bias, we then add in a control group c→ representing a control on community observables such as racial composition and crime levels. This yields a very similar equation:
where σ→ is the coefficient on each respective characteristic. Controlling even further, we add in the vector s→ controlling for school observable characteristics ranging from teacher training, community partnerships, anti-crime policies, and established plans in case of various emergencies. This also yields a very similar equation:
where ρ is the coefficient on each respective school characteristic. This we feel creates the most accurate model possible to determine the effect of crimes on the lowest achieving students. By controlling for as many observable characteristics as possible, we remove the maximal amount of bias possible from our model. By unpacking the categories of violent and non-violent crimes, we can distinguish ourselves from the majority of the current literature by directly examining the effect of specific crimes with achievement. Our major concerns with omitted variable bias lie with our inability to include data on SES; the question was included in the actual survey, but results published did not include SES statistics in the data set. We feel like this would have a strong effect on raising the R-squared value, and its inclusion would reduce the effect of crime. In addition we feel that the inclusion of free and reduced lunch statistics would allow us to instrument for allocation of Title I funds, but unfortunately this was not included in the data sets.Continued on Next Page » This article was published in A publication of University of Texas at Austin 
From the Inquiries Journal Blog   Related ReadingJournalQuest is a free program to help academic student publications increase online readership and distribution. If you are interested in enrolling a journal at your school, please visit the JournalQuest website. Monthly Newsletter SignupThe newsletter highlights recent selections from the journal and useful tips from our blog. Suggested Reading from Inquiries Journal
Inquiries Journal provides undergraduate and graduate students around the world a platform for the wide dissemination of academic work over a range of core disciplines. Representing the work of students from hundreds of institutions around the globe, Inquiries Journal's large database of academic articles is completely free. Learn more | Blog | Submit Follow IJ
Latest in Economics |