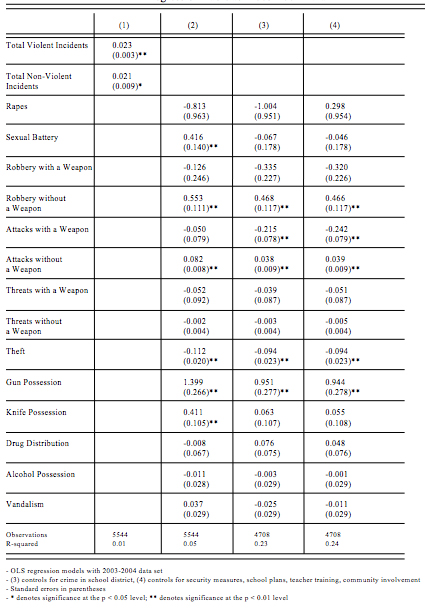
From The Developing Economist VOL. 1 NO. 1The Effect of Crime on Achievement: The Differential Effect of Violent and Non-Violent Crimes on Achievement in High SchoolsV. OLS Regression AnalysisWe will leave a portion of the data analysis to the reader, but would like to highlight a few basic points: The effect of nested violent and non-violent crimes, the effect of separating apart said variables and seeing the distinction within individual distinct crimes, the effect of controlling for community observables, and the effect of controlling for school characteristics. A basic regression on achievement from violent and non-violent crimes is displayed in (1)-figures 1,2 for 2003, 2005 respectively. The data from 2003 shows a distinct negative effect of both kinds of crimes, while 2005 only displays a significant effect from violent crimes, albeit a very significant effect. This shows the intuitive effect of crime on achievement, a step that many previous researchers, both academic and policy, have stopped at. We found that though the results from 2005 supported our argument that violent crimes were "worse" for achievement, we were left unsatisfied and wondering if specific crimes had different effects. Additionally, with an R-squared value of 0.01, it may be questionable to rely on this model as a basis for policy making. Column (2) provides the effect of each individual crime, but some values seem to deviate from what is expected, specifically: rapes, threats with a weapon, theft, and alcohol possession. The data from 2003 show an insignificant effect of rape, robbery, all threats, drugs, alcohol and vandalism. Of these, the significance of rape and theft stand out as being unexpected. We felt that this may be due to individual characteristics of schools, and fully expected these to change once controls were put in place. With the variable of rape, we specifically noticed that the average for each school was 0.0106, and the maximal value for any school was 3. This low number, along with the nature of the crime and possibility of it going unreported by victims, might have lead to this interesting pattern in both years. Further confusing us was the positive effect of theft; we postulate that theft may be a "basic" level of crime, as the survey defined an occurrence as any time when property over $10 was taken, and that vigorous punishment may deter peers from dabbling in related crimes, improving their academic achievement. The data from 2005 show a generally more significant coefficients, but some values still seem curious. The t-value for rape still remains insignificant, and we postulated that the same effects from 2003 may still occur. Even more puzzling, however, is the fact that though theft becomes insignificant, the beneficial effect of alcohol possession becomes significant. Again, no clear explanation can be provided for this effect being positive, but we again postulate that it may be due to the same reasons as theft in 2003.
Figure 3: Regression Table for 2003-2004 Data 93
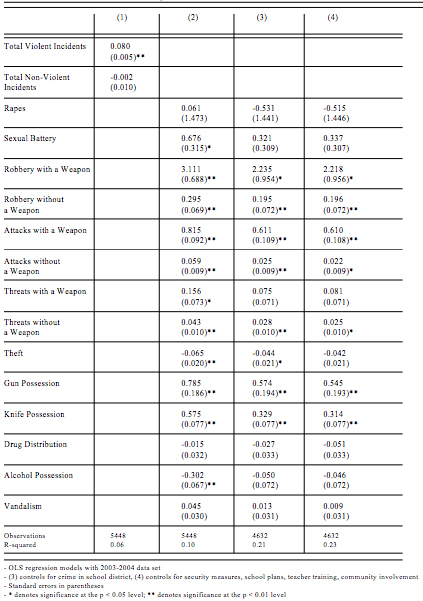
Figure 4: Regression Table for 2005-2006 Data Controlling for the community effects of crime in the school area, crime in students neighborhoods, and racial demographics yields column (3), a more "accurate" display of the externalities of crime. In both the data sets for 2003 and 2005, this does not yield dramatic changes in the model results, despite increasing the t-values for some of the insignificant results. Further controlling for the plethora of school characteristics, including teacher education with respect to crime and community partnerships, column (4) displays what we deem the most accurate representation of the effects of crime on education in current literature due to its effective use of controlling for observable characteristics and division into specific crimes. The supplementation of these controls most dramatically displays itself in the huge additions in statistical significance to knife possession and theft in both years, but somewhat curiously, it results in opposite changes in significance for threats with a weapon between the two years. This may possibly be due to the somewhat ambiguous nature of the question and possible crosscorrelation with knife possession, as it is up to the principal if brandishing a knife would be classified as a threat or a possession crime. With the full set of controls included (4), we were willing to begin addressing the importance of magnitudes for each individual crime, as well as several control variables. Among the statistically significant variables, the majority have a coefficient −0.25 < μq < 0.25 (which represents a change in the percentage of low achieving students of less than 0.25%), which while significant from a statistical application, has what we would consider an insignificant impact when viewed through the lens of "real-world" changes. After these "insignificant" variables are removed, a strong change can only be seen in the categories of: Robbery without a Weapon, Gun Possession, Attacks with a Weapon, and Knife Possession. Of these, there are several inconsistencies between the two data sets, but the 0.466 coefficient on Robbery without a Weapon (2003) and 2.218 coefficient on Robbery with a Weapon (2005) represent significant detrimental correlations on the low achieving population. Additionally Gun Possession in both years, 0.944 and 0.545 coefficients respectively, also has a significant correlation with low achievement. Among the control variables used, the presence of crime within the region near the school had a very strong correlation with low achievement, which is to be intuitively expected. Other control variables fell within accepted and expected ranges. The key findings of this analysis lie in the fact that even though the vast majority of crimes deemed "violent" in the 2005 data set are strongly significant, none of the "non-violent" crimes are statistically detrimental to achievement; in fact the 2003 theft is beneficial possibly due to the peer effects from punishment discussed above. This shows a dramatic difference in the effects of specific crimes within each category, and shows that only by looking deeper within the variables can we show that contrary to popular belief and papers (Wei andWilliams 2004), non-violent crimes are not detrimental towards achievement in struggling students. VI. Error and CausalityEven though the data analysis supports the intuitive effects, it is important to examine any sources of possible error in our study. Due to our cross-section method of analyzing the data, we are unconcerned about the presence of serial correlation, though if our sets were to be combined it would need to be addressed. More concerning, however, is the probable presence of heteroscedasticity within our analysis, likely among associated variables (i.e. Attacks with aWeapon and Possession of a Knife). While it would be difficult to control for this error within the limits of our data set, based on the nature of the error, coefficients would remain unchanged if controlled and we would infer a slight drop in standard deviation. While this may make some variables statistically significant, their low coefficients would still render them "insignificant" from a policy perspective. Additionally, there is a significant chance of some omitted variable bias in our study. As discussed earlier, the SSOCS does not include published information of SES through school lunches, which we believe would have a large impact on our R-squared value. We also wish that several variables included in later versions of the SSOCS (including the presence of metal detectors and security personnel) were available in early versions so that further study could be performed on cost-effectiveness of prevention measures. It is also extremely important to highlight that while many of the correlations here may intuitively seem causal, our analysis is unable to effectively prove said claims. Instead we are only able to show a strong correlative effect which lends some weight towards a policy argument for causality. As discussed earlier, if the data set allowed for a longitudinal study (or a more effective quasi-experimental study) a much stronger argument towards causality could be evaluated. VII. ConclusionOur primary goals for this study were to analyze the untold effects of specific crimes in an attempt to create a greater body of knowledge in the field, and help to explain certain unexplained externalities within current data fields. Through our use of a regression model, we have successfully demonstrated this, and in fact have established an important differentiation between specific violent and non-violent crimes and their respective correlation on the achievement of underperforming students. This could have dramatic policy implications within the modern school system as current funding through programs such as social norms highlight drug and alcohol usage while using significant sums of money. In a world described by Gary Becker that runs by the "Allocation of scarce resources to satisfy unlimited competing wants," educational policy makers must make the most efficient choices possible with their scant funding in the hope of creating a better tomorrow for their students. As our data analysis lends evidence that violent crimes have a strong negative effect on achievement while non-violent crimes do not, current policy makers should consider a change in funding allocation from non-violent crime prevention towards violent crime prevention in order to maximize efficiency. References
This article was published in A publication of University of Texas at Austin 
From the Inquiries Journal Blog  ") Related ReadingJournalQuest is a free program to help academic student publications increase online readership and distribution. If you are interested in enrolling a journal at your school, please visit the JournalQuest website. Monthly Newsletter SignupThe newsletter highlights recent selections from the journal and useful tips from our blog. Suggested Reading from Inquiries Journal
Inquiries Journal provides undergraduate and graduate students around the world a platform for the wide dissemination of academic work over a range of core disciplines. Representing the work of students from hundreds of institutions around the globe, Inquiries Journal's large database of academic articles is completely free. Learn more | Blog | Submit Follow IJ
Latest in Economics |