From Clocks and Clouds VOL. 6 NO. 1Let Them Export Cake: An Examination of The Role of Economic Freedoms in Fostering Intra-EMU Export GrowthSection III: MethodsWith this theoretical framework having been clearly explained, an indepth characterization of the different variables to be used in this paper is now needed. For reference, the majority of the terms used to describe variable coding and operationalization are drawn from Chaudoin, Milner, and Pang (2015). The outcome variable in this paper is the average growth in intra-EMU bilateral exports over the temporal range from 1996-2003. It may also be termed our dependent variable. The current method that allows for the synthesis of such a variable is the gravity model, which is known for having provided "some of the clearest and most robust empirical findings in economics" (Aristotelous 2006). The much aforementioned Professor Aristotelous has given me consent to use the gravity model from his 2006 paper – which will be discussed shortly – as well as the empirical results from said model for the purposes of this project; hence, a new gravity model need not be constructed. Notwithstanding, it is obvious that the same unit and temporal boundaries adopted in Aristotelous' paper must therefore be adhered to in this paper's analysis as well for the purpose of coherence. A final note on the temporality of this paper's data: the beginning of the sample period I consider, just as with Aristotelous' paper, matches up perfectly with the sample period from Micco et al.'s 2003 paper, and, as stated by Aristotelous and Micco et al.,"the shorter the time period used, the lower the endogeneity bias in the EMU coefficient due to the optimal currency criteria. Thus, the beginning of the sample was set to 1992 to limit the endogeneity bias" (Aristotelous 2006).2 In short, the relatively restrictive temporal limits of this research need not be sheerly a negative point. Now, an elucidation of the source of my pre-coded independent variables is appropriate. The theories previously explored suggest that different types of economic freedom would be promising potential causal mechanisms behind the differential bilateral trade growth effects experienced by the EMU nations; however, finding a variable that quantifies a concept such as "trade openness" or other types of economic freedom proves quite difficult. I searched through a variety of reputable data sources, including the WTO, IMF, World Bank, Peterson Institute, ICC Open Markets Index, and the Heritage Foundation. Of all of these sources, the only database that had adequate codebook information, pre-coded variables, and a data set that spanned the timeframe necessary was the Heritage Foundation's Index of Economic Freedom (O'Driscoll et al. 2001). This database, which provides yearly national scores for overall economic freedom, as well as 10 other disaggregated scores that rank various components of economic freedom and are used to formulate the overall score, includes a detailed description of the codebook behind the codification of each score. Having now elucidated the general nature of the variables to be examined in this paper, an exposition of their codification is needed. A final clarification needs to be made, however, with respect to state capacity and enforcement. The enforcement capacity of the EU is widely criticized, but not with respect to their oversight of the common market and the elimination of tariff barriers to trade (Crowley 2005). For this reason, it is safe to assume that all EMU nations are complying with the regulations that maintain the common market – such as the mandate to allow no intra-EMU tariffs, for example – as this area of oversight is one in which the EU has historically excelled, even if in other areas they have been less successful (ibid).3 Having justified these presumptions of scope and capacity, the presentation of my variable codebook is now appropriate.
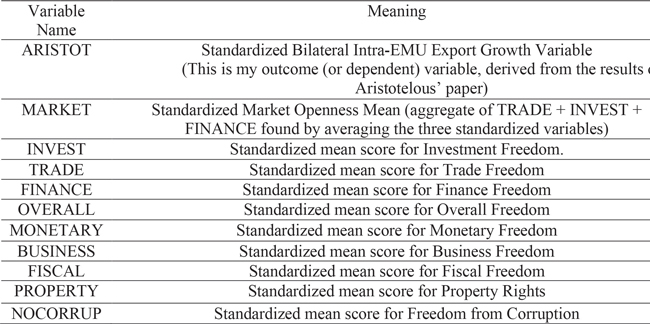
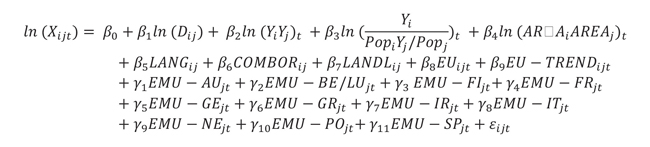
Table 1. Variable coding information including variable name and meaning * Each of the above variables, with the exception of ARISTOT, were taken from the Heritage Foundation's Index of Economic Freedom. The codebook for each of the variables is freely available online at their website, and should be referenced for any and all questions about the codification of specific variables (http://www.heritage.org/index/about). The one exception is Market Freedom, which is a variable I synthesized from the aggregate of Trade, Investment, and Finance Freedom, inspired by the research accompanying the Heritage codebook. ** It should be remembered that year-by-year data were available for the Heritage database, but the coefficients from Aristotelous' data set pertained only to the total effect experienced over the course of the temporal range from his paper. As a result of this, each of the standardized variables synthesized using raw data from the Heritage database were synthesized taking the mean of the temporal range (1996-2003) for the sake of statistical consistency and reliability. These temporal limitations are what preclude me from being able to empirically prove that EMU had a moderating effect on the impact of the various types of economic freedom on outward intra-EMU trade; although the argument that EMU did serve a moderating effect is strong enough regardless given the theory and scholarly support previously expounded. While all information pertaining to the variables from the Heritage database is available online, the formula behind the variables from Aristotelous' paper merits brief explanation. Aristotelous' country-specific bilateral trade growth coefficients come from the following econometric model:
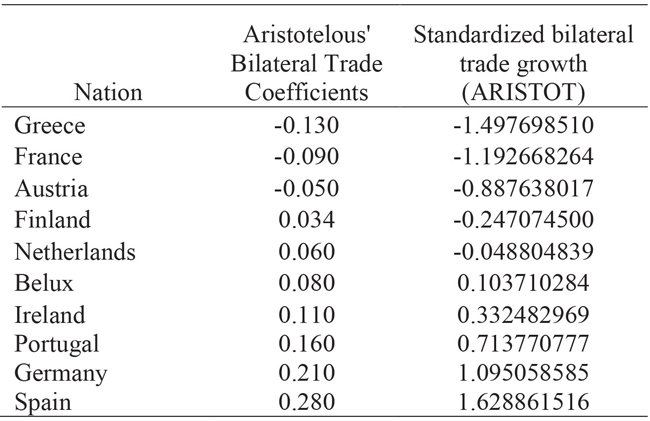
"Given the specification of the equation, the coefficients of interest in this study are all the ‘γs'. Each γ captures respectively the effect of EMU on … [a nation's] trade with other EMU countries." (Aristotelous 2006) For the purpose of this paper, it is the country-specific γ variables that are borrowed and then standardized that serve as my dependent outcome variable. As an example, γ1 once standardized becomes Austria's ARISTOT variable value. For further information on the dummy variables included in Aristotelous' gravity model, see Aristotelous' 2006 paper – particularly his section on Model Specification. Having established these variable labels, the 10 hypotheses can now be conceptualized as tests of relationships between said specific variables as follows: H1: As a nation's Market Openness increases, so too will its weighted intra-EMU export growth. The empirical analysis to be employed will consist first of ten bivariate regressions – one for each of the above hypotheses – with the resulting R2 and Pearson Coefficient values being recorded. Subsequently, standard statistical tests will be applied so as to derive a p-value from the Pearson Coefficients, resulting in a p-value for each of the hypotheses. Using these p-values, I will seek to establish whether or not I can reject the null hypotheses in each of the 10 cases. As would be assumed given the model, standard one-tailed probability will be used. Section V: Empirical AnalysisThe first stage of my empirical analysis involved the normalization of my data, as otherwise it would be statistically impossible to compare the dependent and independent variables. Using standard statistical methods, the outcome variable was achieved by normalizing the bilateral trade coefficients from Aristotelous' 2006 paper, thereby yielding my ARISTOT variable, shown below.
As there are 10 independent variables, the normalization process for only one exemplar will be shown. Similar techniques were used for the normalization of the dependent and independent variables. This process was repeated for all independent variables, and the first step of converting the mean overall scores to a standardized form is shown in Table 3.
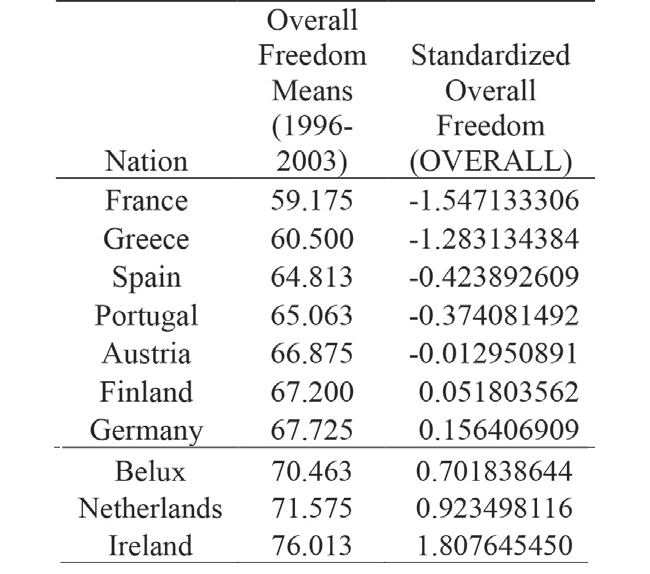
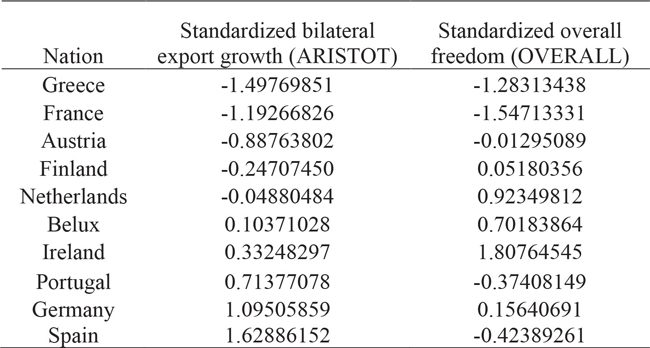
Table 3. Nations sorted by overall economic freedom including mean of their overall scores from the Heritage index synthesized using yearly pooled data from 1996-2003 as well as OVERALL – the variable representing the standardized form of the mean overall scores. Having normalized both sets of variables (independent and dependent), I can move on to regress OVERALL against ARISTOT using the standard statistical functions. The combined table used for the ARISTOT vs. OVERALL regression construction is thus structured as follows:
Table 4. Nations sorted by standardized bilateral export growth – ARISTOT – with corresponding standardized overall freedom – OVERALL. Having seen an example of the method by which the regressions were constructed, Table 5 below includes the results from all 10 regressions.
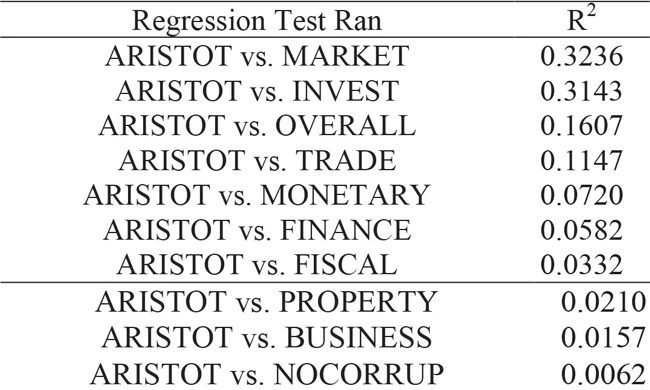
Table 5. Summary of R2 results from all empirical analyses conducted sorted from highest to lowest values for R2. At this point, the empirics do not yet allow for the support or rejection of the various hypotheses. For this, p-values must be obtained for each variable relationship. Using standard statistical methods, the following data were obtained.
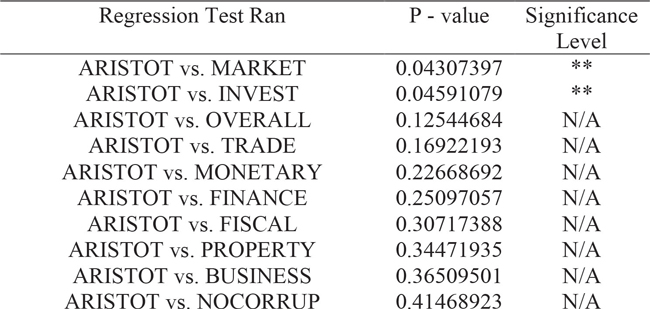
Table 6. Summary of p-values from all empirical analyses conducted, sorted from lowest to highest p-value, in descending order of statistical significance * = 0.1 Confidence Level (CL); ** = 0.05 CL; and *** = 0.01 CL Given the p-values and corresponding significance levels discovered by the empirical analysis, I can now summarize the findings by identifying which null hypotheses I can and cannot reject, subsequently rejecting all hypothesizes that cannot be supported in a statistically significant manner. See a summary of the findings in Table 7.
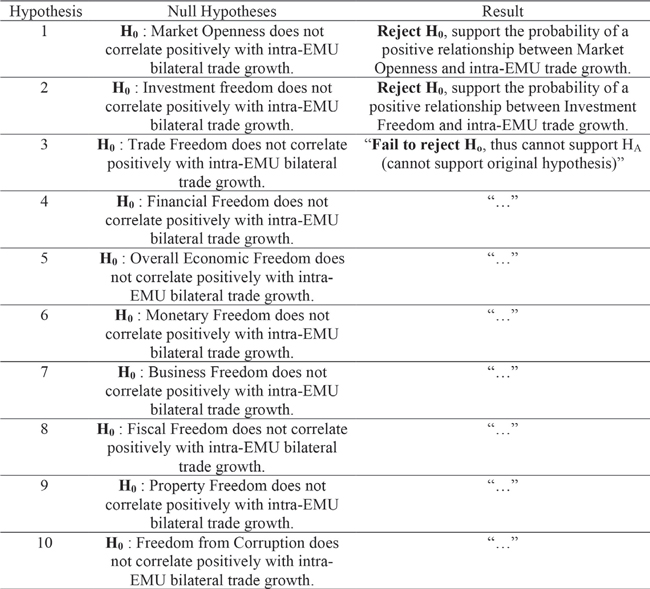
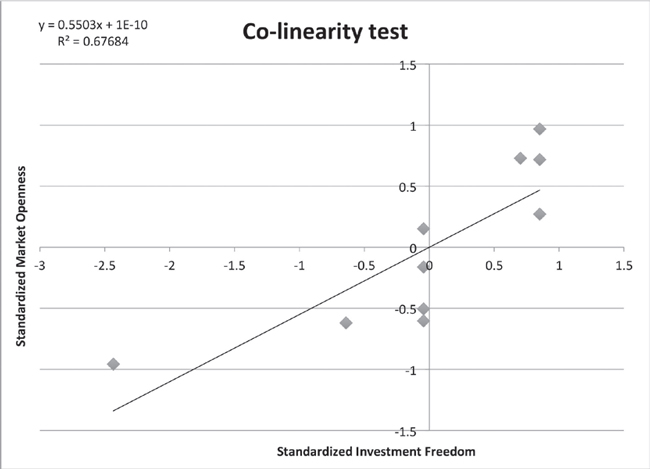
Table 7. Null hypotheses listed with corresponding summary of findings – either reject or failure to reject – along with brief justifications Discussion of Empirical FindingsAs can be seen, of my 10 originally proposed hypotheses, only two of them hold true at a statistically significant level**; hence, all others can be rejected. Granted, the data were limited by their restricted temporality (19962003) and by the dearth of year-by-year intra-EMU bilateral trade growth data; therefore, if more substantial data become available, a richer analysis can be conducted. The data indicate that Market Openness would be the variable with the highest degree of predictive power when it comes to predicting intra-EMU bilateral export growth, as H1 is empirically supported at a statistically significant level** to a slightly greater degree than H2, which is also supported at a statistically significant level**. That said, in order to fully expound the meaning of the empirical findings, a series of robustness checks need to be executed. Robustness ChecksPrior to concluding that Market Openness (MARKET) truly was the variable with the greatest predictive statistical power, a collinearity test needs to be ran, particularly given the fact that Investment Freedom (INVEST) constituted 1/3 of the aggregate index from which my MARKET variable was synthesized. The purpose of this is to determine the veritable robustness of my statistical results, with an eye towards looking past the simple p-values and determining what the data actually means. "Data weaknesses (such as collinearity) reduce the quality of least-squares estimates by inflating parameter variances;" hence, a discovery of collinearity between the two variables for which the null was rejected would call into question whether both tests can be deemed statistically significant (Belsley 1982). The results from the collinearity tests are as follows.
As can be seen, there is a recognizable collinearity problem with the two variables for which the null was rejected: Market Openness and Investment Freedom. This collinearity is visible both graphically, and in the R2 value: 0.67684, which suggests significant collinearity. While co-linearity is emblematic of data weaknesses, it does not disqualify the reliability of all results, but instead calls for further examination of the results. An explanation for the collinearity and its implications can be found by breaking down the MARKET aggregate variable into its three component variables, as can be seen in Table 8
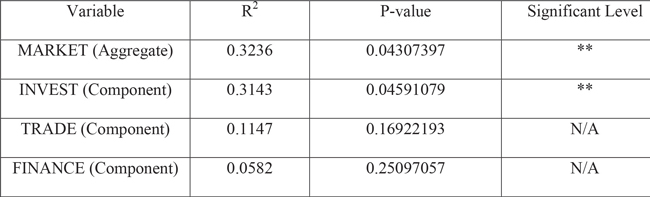
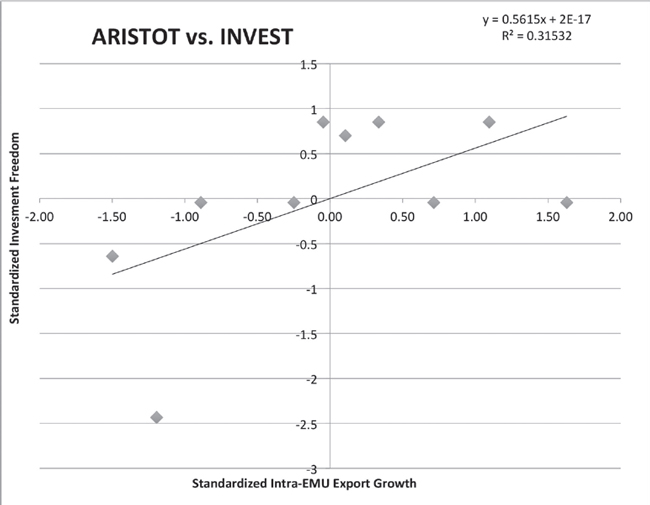
Table 8. MARKET aggregate variable and its three component variables – INVEST, TRADE, and FINANCE – sorted from highest to lowest R2 value, displayed with corresponding p-values and significance levels. * = 0.1 CL; ** = 0.05 CL; and *** = 0.01 CL Upon a detailed examination of the above data, it becomes apparent that the reason for the collinearity between INVEST and MARKET was because the statistical strength of MARKET was upheld almost entirely by INVEST; differently put, Investment, Trade, and Financial Freedom were not equally important in determining the statistical strength of the correlation between Market Openness and growth in intra EMU outwards trade – it was the disproportionate correlative strength of Investment Freedom that rendered the MARKET aggregate variable statistically significant as well. Thus, my data actually suggest that the one hypothesis most promising in terms of its potential to serve as a general covering law as per the methodological motivations of this research is H2, as H1 – while statistically significant – derived its correlative strength only from one of its composite variables – Investment Freedom – the power of which is already more precisely captured by H2. As a result of this, the statistical tests pertaining to Invest Freedom merit additional focus. The regression information for Investment Freedom is shown graphically in Figure 2.
Figure 2. Regression of Standardized Investment Freedom (INVEST) on the x-axis against Standardized Intra-EMU Export Growth (ARISTOT) on the y-axis. R2 value of 0.31532 suggests presence of moderate positive correlation. Upon a more detailed examination of the regression it becomes clear that visually there appears to be an outlier in the lower-left quadrant. This data point represents France, which stood out amongst all other nations for which data was gathered as having surprisingly low Investment Freedom as compared to the rest of the EMU adherents. This can perhaps be even better illustrated in table form, as in Table 9.
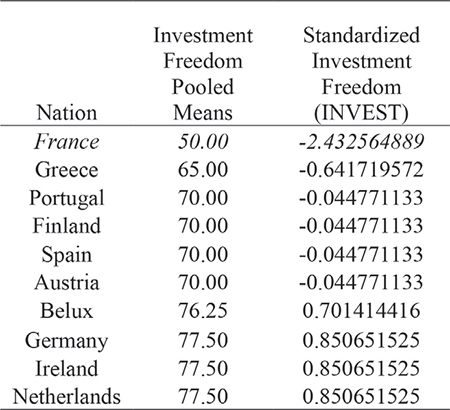
Table 9. Nations sorted from lowest to highest level of investment freedom, in both standardized and non-standardized form. (Average of pooled means is 70.375 and standard deviation is 8.376). As can be seen from Table 9, France is a clear outlier with substantially lower Investment Freedom than all other nations considered. In fact, every EMU nation lies within less than one standard deviation from the mean Investment Freedom score of 70.375, with the exception of France, the score of which lies more than two standard deviations below the mean. Out of all variable relationships tested in this experiment over the course of the 10 separate regressions ran, France's score for Investment Freedom was by far the most outstanding outlier. The other intriguing yet not unexpected trend in the data pertains directly to the current Greek financial crisis that in no small part inspired this paper. The nation that most consistently and holistically placed in the same strata of the various indices of econometric freedom was Greece, which ranked lowest in Freedom from Corruption, Property Rights, Monetary Freedom, and Financial Freedom. In the case of each of these four variables, Greece scored 1.5 standard deviations below the mean or worse, once their scores were standardized. This suggests that further investigation into the specific case of Greece with a particular focus on government restrictions on various elements of economic freedom could prove fruitful.Continued on Next Page » From the Inquiries Journal Blog   Related Reading JournalQuest is a free program to help academic student publications increase online readership and distribution. If you are interested in enrolling a journal at your school, please visit the JournalQuest website. Monthly Newsletter SignupThe newsletter highlights recent selections from the journal and useful tips from our blog. Suggested Reading from Inquiries Journal
Inquiries Journal provides undergraduate and graduate students around the world a platform for the wide dissemination of academic work over a range of core disciplines. Representing the work of students from hundreds of institutions around the globe, Inquiries Journal's large database of academic articles is completely free. Learn more | Blog | Submit Follow IJ
Latest in Economics |