From the FieldBoda Boda: The Impact of Motorbike Taxi Service in Rural Uganda4. Research Methods4.1 Questionnaire, Methods, Research GoalsThis study aims to provide relevant insights into how the transport service offered by the "Boda Boda" can ensure a better integration between the rural villages’ economies and the Southern Ugandan economic network, thus promoting the improvement of the rural citizens’ welfare. The analysis of the socio economic realities of the area and the evaluation of the research objectives rely on the collection of data from three sources. The first source is a baseline long form questionnaire administered to 148 citizens of the village of Kigarama. A second baseline long form questionnaire was administered to 120 citizens of the village of Nangara. The questionnaire interview for the village citizens lasted between 30 to 40 minutes each. The second source is a baseline long form questionnaire to be administered to the Boda Boda operators. The questionnaire interview for the Boda Boda operators lasted between 40 to 50 minutes each. The baseline long form questionnaire for the rural citizens of Kigarama and Nangara contains details regarding the citizens’ approach to the transportation problem. It also provides a precise description of the households’ economic and welfare situation. The questionnaire also comprises of questions about the citizens choices regarding agricultural produce commercialization in terms of location, profits, and transport choices. The baseline long form questionnaire for Boda Boda operators contains a detailed description of their decision making process regarding their services. It provides a clear description of their operating costs, income, and health status and gives insights on the Boda Boda operators’ perception of the rural areas socio economic development. The questionnaires were designed taking into account the anthropological aspect of the Boda Boda transport services. The research investigates the phenomenon in its natural and sociological environment exploring its meaning for the rural population. Particular attention is paid to gender disparity, the religious and ethnic differences in the region, and the perception of criminality which might affect access to the service.Within the two selected villages my target sample population consisted of 150 individuals for each village. The participants to the survey were chosen among the population with decision making power regarding transportation choices and household expenditure. Thus, the participants were the heads of households. It is worth noticing that in many South Uganda villages, households could comprise of single mothers; it follows that the bias against female monetary decision making was not an issue in this project. Due to the specific objectives of this research I excluded from the participant pool the population under 18 years of age. The selection of the sample population of the villages to be interviewed began with a meeting with the village chief to get a list of its inhabitants. The formal authorization for the directory of the citizens of the village was obtained on site with the signing of the village chief of a permission form. The list was alphabetized and subsequently, through a random number generator I extracted the names to be interviewed. Within the Boda Boda drivers population the sample consisted of 40 subjects. The only exclusion criterion was being on the job less than six months.The selection of the sample of the population of the “Boda Boda” drivers to be interviewed began with the access to the offices of “Boda Boda Association Drivers of Kabale” where the list of operators officially registered was acquired. The formal authorization for the directory of the Kabale Boda Boda drivers was obtained on site with the signing of the Kabale Boda Boda Association President of the permission form. Again, the list was alphabetized and subsequently, through a random number generator I extracted the names to be interviewed. I performed two rounds of interviews. The first round took place between December 16, 2013 and January 4, 2014 and the second between January 6, 2014 and January 20, 2014. The third source of data was collected from the County and Sub-County Offices in Kabale District and was aimed to obtain official information regarding census and Boda Boda operators. Administrative records were collected during visits to the County and Sub-County offices in the first week of the field work and took between 2 to 4 hours per visit. 5. Results5.1 DemographicBefore beginning a quantitative analysis of the data, it is important to give a brief description of the two villages’ location and demography. Kigarama is located in the south side of the Kabale district, and lies 6 Kilometers from the closest all seasoned road. It is a remote settlement with a mature population and with a relatively high education level. Nangara, on the contrary, is located north of Kabale District, at around 2 Kilometers from the closest all seasoned road, and has a younger population compared to Kigarama. The following graphs show a quick snapshot of the demographic characteristics of the two villages. The two communities show the same educational level mean; however, it is important to note that Kigarama comprises of a higher number of people who have completed secondary school. This detail will be of particular interest later in the analysis. The age distribution among the two communities does not show striking differences even though Kigarama presents more individuals of old age. Kigarama Education Level and Age Distribution
Nangara Education Level and Age Distribution
The following four graphs show a snapshot of the economic situation of the two villages. Both are considered, by international standards, below the poverty line, and even though Kigarama is slightly richer compared to Nangara, they both devote around 30% of their monthly savings level to Boda Boda expenditure. Kigarama Average Monthly Savings Level and Boda Boda Expenditure
Nangara Average Monthly Savings Level and Boda Boda Expenditure
The following graphs provide a sense of the distances between every household in the two villages to the closest functioning clinic and the central market. The graphs also show the Boda Boda transportation costs for reaching those facilities. The data illustrates the higher costs, due to higher distance which Kigarama citizens must bear in order to take advantage of the only transportation system available in the area. Distance to Clinic in Kigarama (left) and Nangara (right)
Distance to Market in Kigarama (left) and Nangara (right)
Cost to take Boda Boda to Market in Kigarama (left) and Nangara (right)
Cost to take Boda Boda to Clinic in Kigarama (left) and Nangara (right)
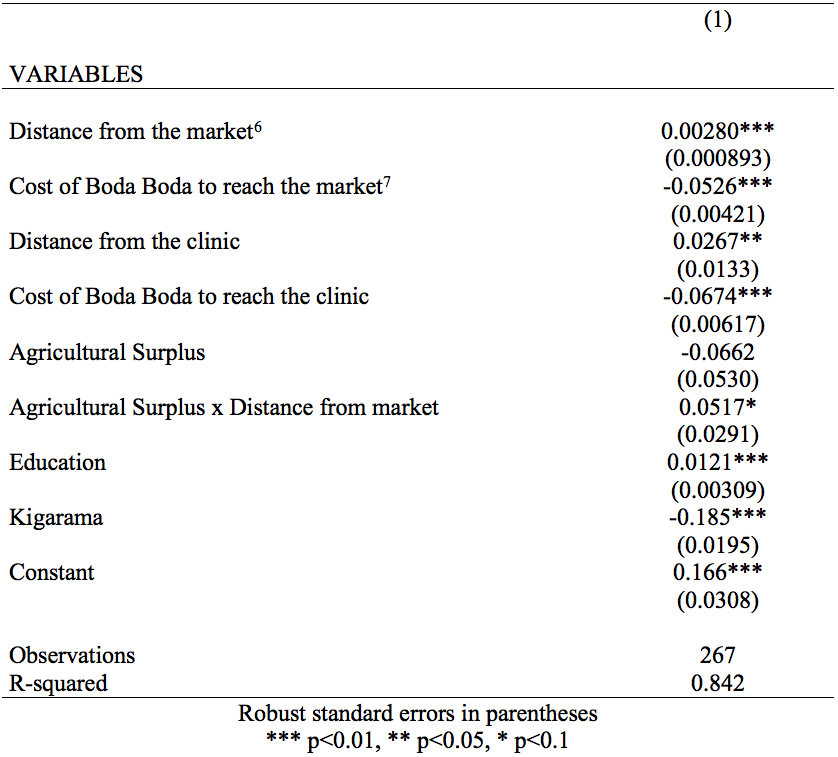
5.2 EconometricsThis section develops an econometric model to discover the factors influencing the propensity to use the Boda Boda motor taxi system among the investigated rural population. Several scholars have shown how welfare can be measured through the proportion of the population having access to basic services. Economics scholars suggest that the easiest method to calculate well-being is to include in any econometric model the access to markets and health services (Hu et. all 2011, p.225). The model I propose in this research considers then the distance of the market from every single household, and the cost incurred to reach it. It also considers the distance of the closest clinic and its relative transportation cost. Those four factors are reliable proxies for measuring the personal welfare. It is essential to note that I decided to measure the distances in hours on foot, instead of kilometers. This method is more appropriate since it takes into account the characteristics of the hilly environment of the area. In those regions it is usually very complex to calculate an objective metric distance. This first model calculates the personal propensity to use the Boda Boda transportation system; it is, therefore, appropriate to utilize the subjective perceptions of the distances from the closest market and the closest clinic. Before beginning the econometric analysis and the data discussion it must be noticed that for the individuals who declared to have never used Boda Boda, I had to impute a potential price. I created a model for assigning to each of those observations the most appropriate price for the use of the Boda Boda transportation system. I analyzed the distances of those households to the clinic and the market, and I compared the prices paid by households, located at the same distances, for using Boda Boda to reach those facilities. I then computed the average prices for every specific distance, and then I assigned those potential prices to the households which do not use Boda Boda. The econometric model utilized is a linear binary choice probability model which implies that the probability of the event α occurring is assumed to be a linear function of a set of explanatory variables:
During the analysis of the data I was able to exclude the presence of heteroskedasticity proportional to regressors. I could not exclude, however, the possibility that the collected data was affected by other types of heteroskedasticity. I thus followed the common convention of implying that heteroskedasticity is a general association between the variance of the disturbance term and the regressor. I, therefore, chose to run the following robust regression with correction for White’s heteroskedasticity.
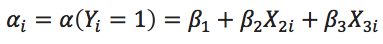
where X is a vector of controls , and Yi is the dummy variable “Use of Boda Boda.” I ran several regressions adding controls to measure the changes in the endogenous variables caused by exogenous factors on the model. These controls are education, age, agricultural surplus, and an interactive variable between agricultural surplus and distance to the market. The results of these regressions are shown in Table 1 and 2. Table 1: Factors Affecting the Demand for Boda Boda in Kigarama
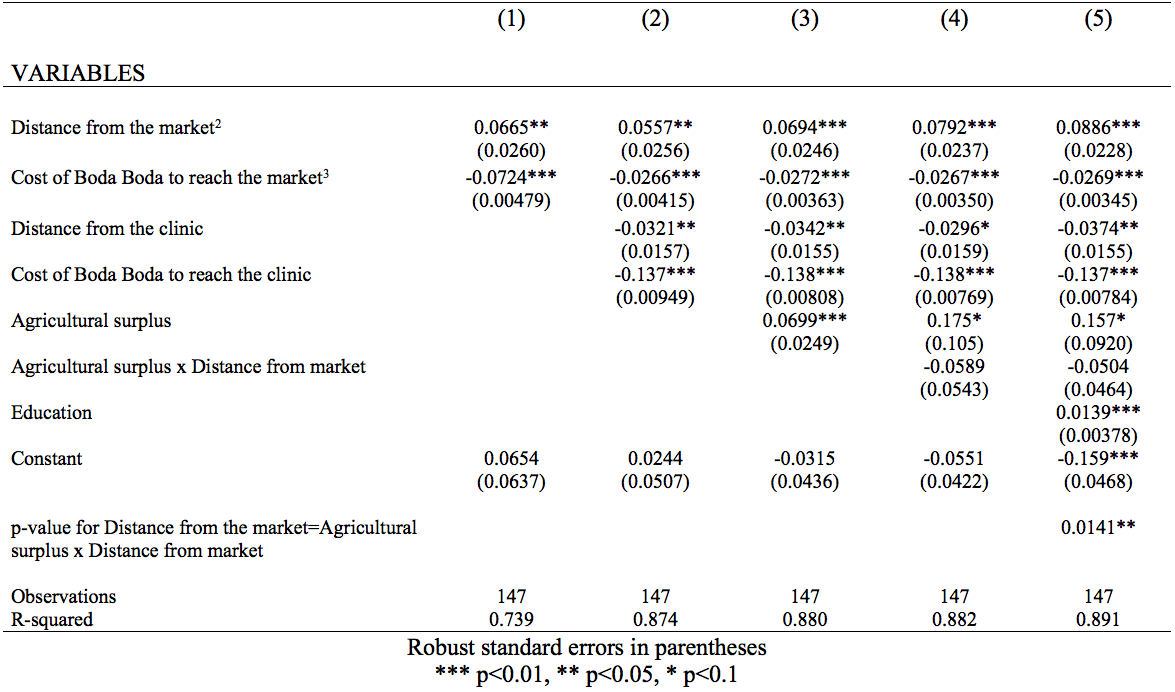
Table 1 shows the results for the village of Kigarama. The first two columns exhibit the result of the regressions using the welfare explanatory variables. The first column shows the market variables’ impact on the Boda Boda utilization propensity. An increase in distance by one hour from the market, controlling for the price paid to reach it, increases the willingness to use the transportation system by 6.65%. On the other hand, an increase of the Boda Boda cost by 1000 Ugandan Shilling, controlling for the distance to the market, decreases the propensity to use Boda Boda by 7.24%. The second column adds the clinic explanatory factors. An increase in distance from clinic, controlling for all other factors, produces a decline of 3.21% in the propensity to use the Boda Boda, and an increase of the taxi service cost, controlling for the other explanatory variables, has a an important negative effect of 13.7% on the willingness to use it. All these results are statistically significant and provide a glimpse on the different reality experienced in rural areas compared to urban settlements. In column 3, 4 and 5, I added controls for, a dummy related to the production within the household of agricultural surplus, and interaction factor between agricultural surplus and distance to the market, and education level (measured in year of schooling). Column 3 shows a remarkably high coefficient for the agricultural surplus dummy which, by itself, increases the willingness to use Boda Boda by 6.99% compared to individuals without agricultural surplus, and controlling for all the other factors. This value is of particular importance. It states that an individual with agricultural surplus will have a much higher willingness to use the Boda Boda service compared to individuals without the option to sell their produce, regardless the distance to any facility. The expected agricultural income induces individuals, who perceive themselves richer, to take advantage of the transportation service. In column 4 I added the interaction term Agricultural surplus x Distance to the market. The negative coefficient, which must be added to the coefficient for distance to the market, tells that individuals with agricultural surplus are less sensitive to distance compared to the other Kigarama farmers’ population. It is reasonable assuming that the lack of produce to sell implies a worse agricultural production for the household. It follows that individuals in this situation are in more need to reach the market. In the same column the coefficient for the individuals with agricultural surplus, regardless the distance to the market, appears extremely high. It is a confirm that the perceived higher income will persuade farmers to use Boda Boda more often. I ran a nested F-test to assess if the coefficient for distance to market and the coefficient distance to market x agricultural surplus are significantly different. The result gave a p-value of 0.0141 which implies that we are 95% confident that they are not equal. The data, therefore, suggests that individuals with surplus are still more likely to use Boda Boda the further they live. In column 5 I added the variable education level which has a high statistical significance. Its coefficient value, which reveals that every year of schooling increases by 1.39% the propensity to use the Boda Boda may seem economically insignificant. On the contrary, in an area where many children do not attend school, the completion of the secondary school, compared to a person who did not attend school, raises the willingness to use the Boda Boda and have access to mobility by 16.68% assuming all other variables constant. This is a noteworthy result. The inclusion of the education variable in the analysis produces important changes in the values of the other explanatory factors. The coefficient for the distance to the market increases by almost a percentage point. It is reasonable to think that the more the person is more educated, the more his/her willingness to reach the market increases due to the realization that is not only a place for exchanging goods, but also a hub for sociality. Living in a remote area might be experienced as a constraint, and the Boda Boda service is seen as a tool to expand the personal network of socialization. In addition, to the extent that education is related, in rural areas, to disposable income, the significance of the coefficient can also be considered as a proxy for ability and willingness to pay. On the contrary, it is remarkable how the coefficient for the clinic distance decreases by 0.78%. This data needs further explanation. It is impossible to state that remote populations in south Uganda do not care about health. In the survey I performed during the study, 72.58% of Kigarama citizens declared that, if possible, they would spend money to bring a sick child or adult to a clinic with a Boda Boda. In their answer lies the truth of living in poor areas. It is almost never possible to make decisions free from economic constraints. An educated person (here we do not have the space to analyze deeply the quality of the education provided in rural areas) acknowledges that there are different priorities compared to the idealized world often promoted by development agencies. A sick child or an ill adult first and foremost has to work in the family’s gardens. The hours possibly spent to go to a clinic are felt as a valuable time diverted from productive activities, thus wasted. Health is felt as important; food production, in an area where subsistence agriculture is the norm, is vital. The following table shows the results for the village of Nangara. Table 2: Factors Affecting the Demand for Boda Boda in Nangara
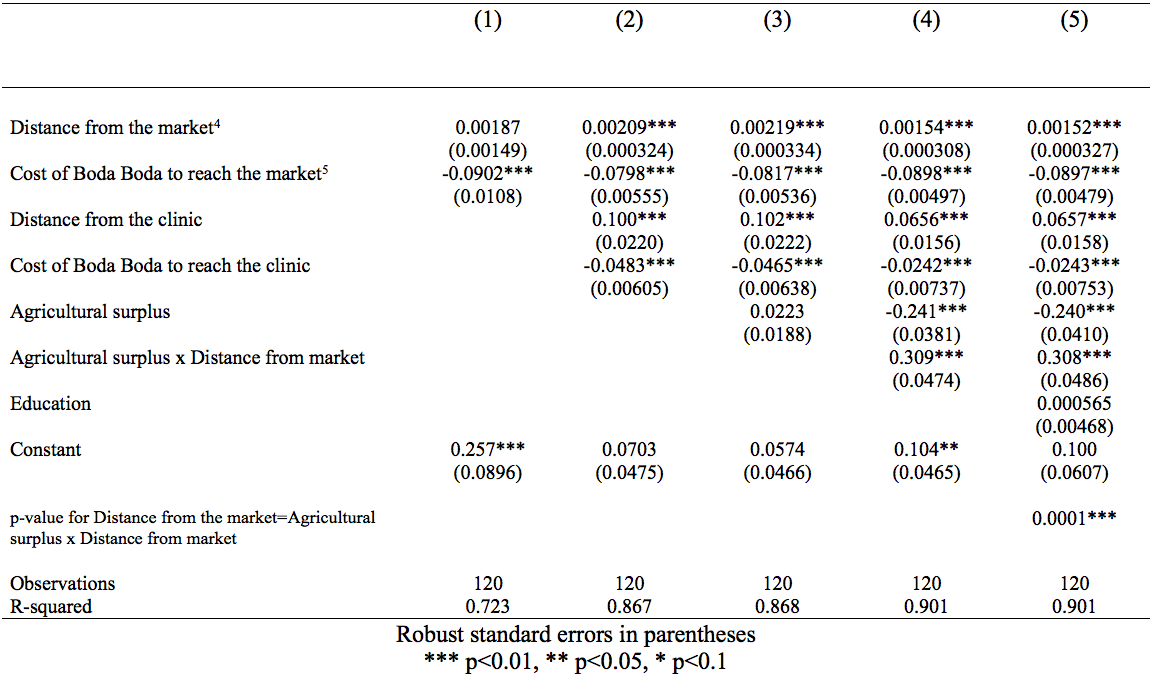
The first two columns exhibit the result of the regressions using the welfare explanatory variables. An increase in distance by one hour from the market increases the willingness to use the transportation system by 0.01%, but this result is statistically non-significant, while the increase of its cost by 1000 Ugandan Shilling decreases the willingness by 9.02% controlling for the distance. This data is consistent with the fact that the village of Nangara is relatively close to the Kabale market and the vast majority of its population declared to usually walk towards the city. On the contrary an increase in distance from clinic produces an increase in the propensity to use the Boda Boda by 10%, and an increase in its cost has again a negative effect on the willingness to use it controlling for the other factors. It is reasonable to argue that the relative closeness to the health facility does not imply a substantial loss of time in reaching it, thus people are not sensitive to its distance. The third column, adds the agricultural surplus dummy, which tells that individuals with the possibility of having agricultural income would have an increase of willingness to use the Boda Boda of 2.23%. The fourth column adds the interactive term between agricultural surplus and distance to the market. The positive coefficient, which must be added to the distance to the market coefficient, tells that in Nangara farmers with agricultural surplus are more sensitive to distance compared to the other village’s farmers. This result is opposite compared to Kigarama, and could be explained by the relative closeness of Nangara to the market. Even though the distance might increase, it is still close enough to allow Nangara farmers to make profits selling produce at the market. The fifth column adds the education coefficient which, by itself is not statistically significant, and does not produce noteworthy differences in the other coefficients. An interesting analysis arises from the evaluation of the overall effect of living in one village has on the explanatory factors we studied so far. The following table shows the same regression used previously, applied to the combined dataset of the two villages. I added a dummy variable in the regression to account for individuals living, or not living in the village of Kigarama. The regression I ran was thus,
Where K is a dummy variable which assumes values=1 if an observation is in Kigarama village and values=0 if it is not, and where X is a vector of controls X = (X1,X2) Table 3: Factors Affecting the Demand for Boda Boda in Kigarama
The coefficients are the averages of the two villages, while the coefficient for the dummy variable Kigarama, statistically highly significant, tells that living in a remote rural hilly area reduces the propensity to use Boda Boda, all other factors constant, by 18.5%. This result confirms that it is the location which affects the opportunity for mobility of the population we studied. 5.3 Econometrics IIA further quantitative analysis of the factors affecting the use of Boda Boda should take into consideration the number of trips every individual is willing to undertake every week. This statistical analysis requires the use of a more advance mathematical tool. The variable “Number of time use of Boda Boda” is, by definition, a counting variable, and follows the rules of the Poisson distribution. It is worth explaining the meaning of this statistical function. A random variable Y is said to have a Poisson distribution with parameter µ if it takes integer values y=0,1,2,... with probability
for µ>0 is the intensity of the parameter. The mean and variance of this distribution can be shown to be equal
A logical consequence of the equality between mean and variance is that any factor that affects one will also affect the other. The Poisson regression model parameterizes the relation between the mean parameter µ and the regressors Xi. It is common to use the exponential mean parameterization
with the assumption that there are k linear covariates. Since
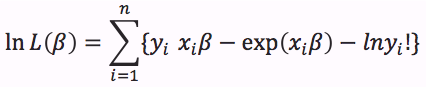
the Poisson regression is heteroskedastic. Given also the assumption that all the observations are independent, the natural estimator is the maximum likelihood. The log-likelihood function is
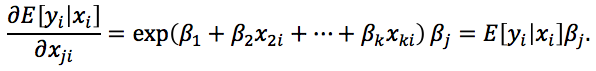
The estimator is then the solution to the k nonlinear equations corresponding to the first order condition. According to the standard maximum likelihood theory, the estimator of is consistent with the true value of β (Cameron, 1999). The interpretation of the coefficient is different compared to the OLS model due to exponentiation.
It follows then that a unit change in the jth regressor in the linear model that I set up, with E[y|X] = Xβ causes a change of the quantity in the conditional mean. This Poisson characteristic fits perfectly the objective of the analysis: every time an individual undertakes a trip with a Boda Boda the decision to have another ride is affected by the previous one. I thus decided to run the following regression
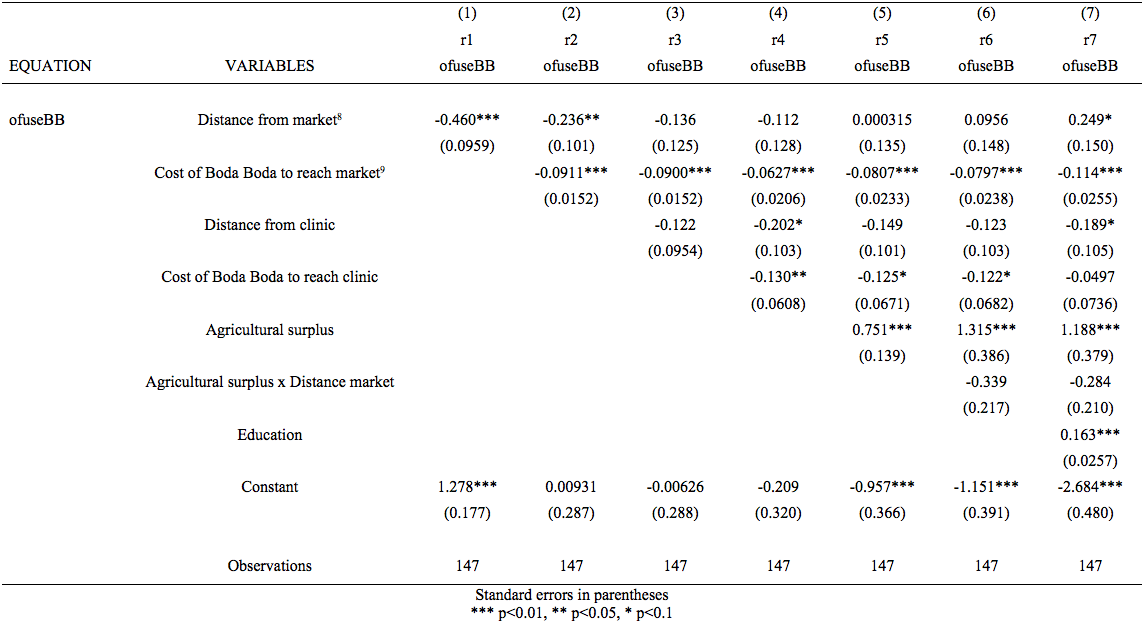
where X is a vector of controls X = (X1,X2). I, again, considered as a proxies for the measurement of personal welfare, the distance from the clinic and the market, and the relative costs for reaching them, while I used as controls the education level, age, and the presence of agricultural surplus. The interpretation of the Poisson regression coefficients, even though it is more difficult compared to the previous binary linear probability regressions, can easily be explained as for a one unit increase in the regressor (the explanatory factor) the expected value of the counting variable increases, or decreases by a percentage of e^Beta. The following table shows the results for Kigarama village. Table 4: Factors Affecting the Number of Times Boda Boda was Used in Kigarama in Previous Month
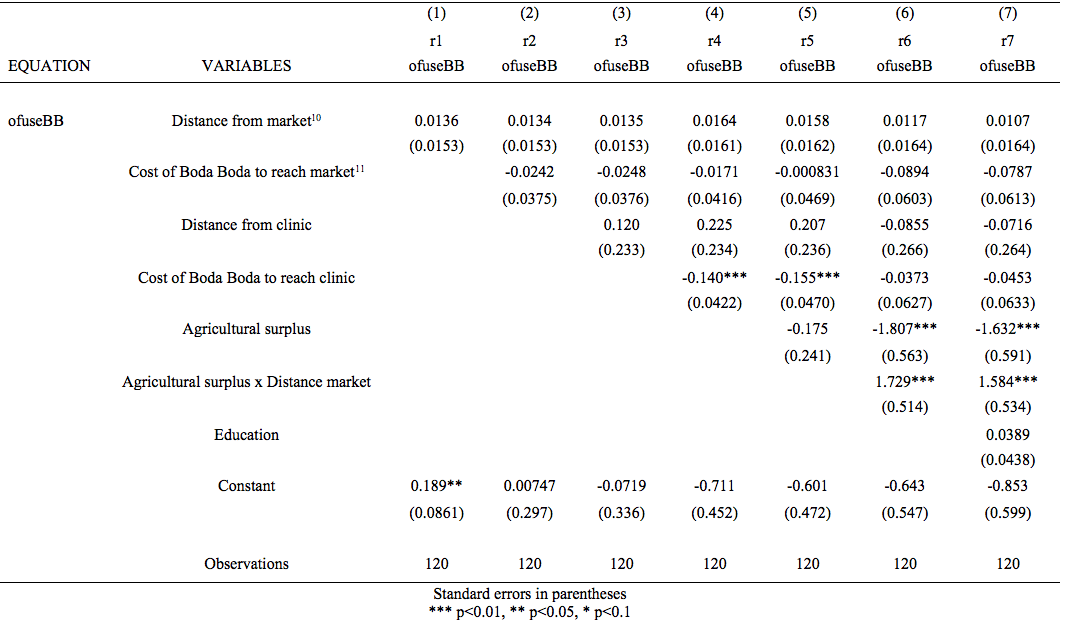
The first four regressions show the impact of the variables utilized as a proxy for welfare on the decision of undertaking more Boda Boda trips. An increase of the distance from the clinic causes the likelihood of undertaking an additional trip to be 81.7 % (since the probability of the additional trip is e^(-0.202) = 0.81709). The data, unfortunately, does not show a statistically significant value for the market distance. The data also shows the importance of transportation service prices in poor rural areas. An increase of 1000 Ugandan Shillings for the Boda Boda service to the market causes the likelihood for an additional trip to decrease by more than 6% while an increase of the cost for the clinic decreases the likelihood of the extra trip by 12.2%. These values are consistent with the findings of a research performed by Cohen and Dupas in 2010 who challenged the general accepted idea that individuals in poor African rural settings are more likely use items or services if they pay for it compared to the goods obtained for free. It is, however, with regression 5, 6 and 7 that the most interesting results arise. The control variable Agricultural surplus has a strong impact on the results. It appears highly probable that it is the availability of produce to sell which mainly dictates the decisions to undertake multiple Boda Boda trips. The presence of agricultural surplus, by itself, causes the likelihood to undertake one more Boda Boda trip to increase more than threefold since e^(0.751) = 2.1191. The level of education is an additional element which seems to encourage Kigarama citizens to use the motorbike taxi system. It is also interesting to note how this variable makes the coefficient relative to the clinic distance to further decrease. I ran the same Poisson regression for the village of Nangara, and the following table shows the results. Table 5: Factors Affecting the Number of Times Boda Boda was Used in Nangara in Previous Month
This table does not show any statistically significant result except in column 4 and 5, for the variable cost of Boda Boda for reaching the clinic. The highly negative values confirm that in Nangara individuals are price sensitive. A puzzling result arises from column 6. In the next to last regression the addition of the dummy variable Agricultural surplus and its interaction with the distance to the market produces counterintuitive outcomes. The Surplus dummy, by itself, suggests that the possibility to sell produce decreases the likelihood of undertaking additional trips by more than 80%. On the contrary, when the same variable is interacted with the distance to the market, the subsequent coefficient suggest an increase in possibility for extra trips by almost 6 times (e^(1.729)). In this case it is rational to assume that the closeness to the Kabale market makes the trip cost relatively cheap and its increase does not imply a serious monetary and time expenditure. The Agricultural Surplus coefficient probably suffers from omitted variable bias and the regression might be not correctly specified.Continued on Next Page »
KEYWORDS:

From the Inquiries Journal Blog   Related ReadingMonthly Newsletter SignupThe newsletter highlights recent selections from the journal and useful tips from our blog. Suggested Reading from Inquiries Journal
Inquiries Journal provides undergraduate and graduate students around the world a platform for the wide dissemination of academic work over a range of core disciplines. Representing the work of students from hundreds of institutions around the globe, Inquiries Journal's large database of academic articles is completely free. Learn more | Blog | Submit Follow IJ
Latest in Economics |