Understanding the 2016 Republican Primary: Substantive Versus Strategic Voting Behavior
By
2022, Vol. 14 No. 01 | pg. 1/1
IN THIS ARTICLE
KEYWORDS
IntroductionWas the selection of Donald Trump in the 2016 Republican Primary a strategic or a substantive choice? Donald Trump defied many predictions when he won the GOP’s presidential nomination despite his initial ‘underdog’ standing and controversial record. However, there is a limited understanding of the interplay between assessments on Trump’s electoral power versus policy and ideological preferences in voters’ decision-making. Scholars have long argued that “viability” considerations strongly affect voters’ choice in primary elections, where substantive information is limited (Bartels, 1988). Others emphasized “substantive” determinants such as voter’s policy preferences (Aldrich and Alvarez, 1994), or the centrality of regret minimization in voters’ decision-making under uncertainty (Ferejohn, 1974). Recent literature proposes a “sophisticated” model for voting, which combines substantive and strategic considerations (Rickerhauser and Aldrich, 2007). Using data from the American National Election Survey in 2016 on that year’s Republican primary, we use a multiple logistic regression model to estimate the effect of information on Trump’s electability prospects on voters’ odds of selecting Donald Trump. We find evidence that information on electability had a statistically significant effect on voters’ odds of voting for Donald Trump, even as we control for policy, ideological and other, demographic variables. TheoryPrimary elections provide a unique opportunity to examine voters’ decision-making. Primaries are contested within parties, so partisanship or ideological distinctions play less of a part in voters’ choices (Aldrich and Alvarez, 1994). Primaries are also spread over several months’ time, which allows late voters to learn about the electability of candidates through the behavior of previous voters (Knight and Schiff, 2010). This sequential characteristic, and the relatively slight differences between candidates’ ideologies, led many voter behavior scholars to emphasize “viability” – candidates’ chances of winning the party nomination, as learned through their standing in preceding primary elections – as an important factor in voter’s choice (Aldrich, 1980; Bartels, 1988). Keeter and Zukin argued that voters in primaries “look for a winner” more than they pay attention to the substance of campaigns (American Political Science Review). Yet other approaches emphasize the weight of non-strategic determinants in voters’ choice. Abramson et al.argued that voters make good use of information on candidates’ viability and their policy standing when making their choice (Abramson et al 1992). Using voters’ position in the 2016 Republican primary voting sequence as an indicator to the degree of available information on Donald Trump’s viability, we set out to test the effect increased information on viability had on voters’ odds of voting for Donald Trump, while controlling for ‘substantive’ variables and other, demographic variables. DataOur analysis uses data from the 2016 American National Election Survey Time Series. We filtered the data set to only include entries for respondents who voted in the republican primary. For the outcome variable, we coded a binary indicator for whether a respondent voted for Donald Trump or not in their state primary (Please see appendix for a table with full information on variables used for this analysis).For our main explanatory variable, we used information on the respondent’s state of voter registration to create a numeric variable that represents the sequence of voting according to that state’s binding primary date (we will call this variable “republican primary session”). The order of voting in primaries was shown to have a momentum effect for candidates who exceeded expectations in early states (Knight and Schiff, 2010). Such was the case in 2016 for Donald Trump, who, after losing the Iowa primary on February 1, took the majority of delegates in the New Hampshire contest eight days later and saw a substantial increase in his poll standing that would last for the remainder of primary season. Voters in primaries learn about the desirability and electability prospects of candidates from the behavior of early voters (Knight and Schiff, 2010). This allows us to use the sequential order of a respondent’s vote by state as an indicator to the information a voter may have on Trump’s electability and desirability: a later position indicates a stronger, and a more complete, image of Trump as the desirable Republican nominee. This is an ordinal, discrete variable that we will treat as a numeric variable for the purpose of this regression analysis. To account for different degrees of exposure to such information, a factor variable for a respondent’s self-indicated level of media exposure (high, moderate, low) was coded and included in our regression model. Three other variables were used to test competing theories on voter behavior. A binary variable was coded to depict whether a respondent supported constructing a wall in the US-Mexico border. We chose the border wall as an indicator for policy alignment with Trump due to the centrality of this issue in his rhetoric during the 2016 primary campaign season. Another explanatory variable is a binary indicator for respondent’s attitude towards sexist remarks (1 if disagrees with ‘women report innocent acts as sexism’; 0 otherwise). This variable is used as an indicator to the respondent’s possible personal attitude towards Trump in light of his contentious remarks during the 2016 primary season, which raised much outcry over their sexist undertone. Finally, we included a numeric variable for respondent’s self-declared percent of support for Trump (‘warmth feeling’). Since this is a post-primary measurement, this variable cannot be used to estimate the respondent’s degree of support for Trump during the primary season, instead serving as a rough estimation of a respondent’s general feelings towards the then presidential candidate. In line with previous research, we included several demographic variables in our regression as well. Binary variables for the respondent’s sex, minority status, and attendance in religious services were coded based on survey questions. Factor variables for the respondent’s level of education, their income level and a discrete, numeric variable for age were also included. We filtered out NAs across all variables, after checking for missingness and finding no substantial loss of observations in doing so (Please see appendix for missingness report.) We present below a summary statistic of the most important variables. Please see Appendix for a full summary statistic of all included covariates.
MethodsTo test the competing theories we constructed five different logistic regression models, ranging from a “basic” model with one explanatory variable (republican primary session), to a full model with a variety of control variables, including interaction terms. As explained above, our outcome variable is binary (vote for Trump: yes (1), no (0)). We used logistic regression because it is ideally suited for binary dependent variables. The outcome can be described as the probability (here: of a respondent voting for Trump) as a function of our explanatory variables (e.g.the respondent’s Republican primary session.) In the context of an election, this approach is analytically useful since Trump’s probability of being voted for by a particular subject is limited to a number between 0 and 1. Our logit model therefore limits our predictions within the range of 0 and 1, which the OLS model does not do. We conducted pairwise ANOVA tests to compare the different models and determine which model best balances explanatory power and the complexity of adding more variables to our regression.1 Running the ANOVA tests shows that the fourth model provided the best trade-off between explanatory power and complexity. Here we present the equation obtained by model 4:2
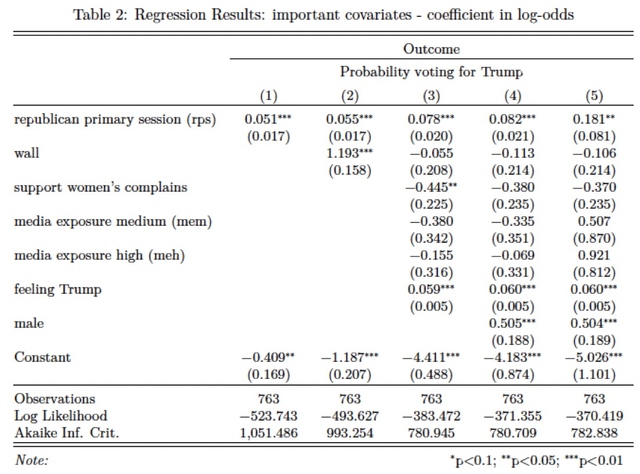
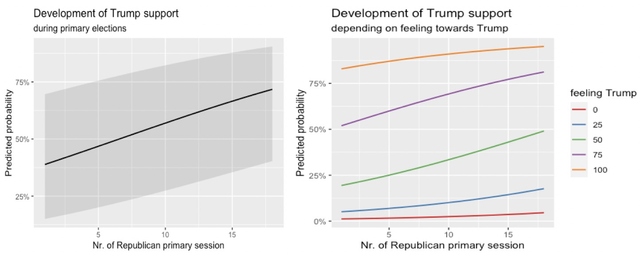
We present all five models in the results section below, but will focus on model 4 in our analysis. ResultsBelow we present a table of the relationship between our key explanatory variables and our outcome of interest (using logit regressions for each model). Due to limited space we only include our main variables of interest. The coefficients in the table represent the change in log-odds.3 We find a statistically significant relationship for our main explenatory variable across all five different models. As we can see below, generally, it appears that chances of voting for Trump in the primaries increased over time (the later a voter voted, the higher was the probability of voting for Trump). A one position movement in primary session towards a later primary date (in model 4) is associated with a multiplicative increase of 1.85 in the odds of a respondent voting for Trump, holding selected ideological, policy and demographic variables constant (an increase by a multiplicative factor of ; p-value: 0.000112 and therefore statistically significant at the 1% level). > The theoretical context of this analysis leads us to highlight findings on the two additional, non-strategic covariates. First, we find that there is no statistically significant effect for support for wall on odds of voting for Trump. Although a statistically-significant effect was found in simpler models, once we controlled for ‘feeling towards Trump’ and media exposure (among other variables), the effect of the ‘wall’ binary variable was no longer significant. Second, we also don’t find a statistically significant difference in model 4 between voters that cared a lot about sexism and those that did not. (Although the ‘sexism’ variable is significant in simpler models that effect goes away after introducing control variables). These results are not only statistically but also substantially important. The fact that we can’t find a relationship in both cases hints at a possible conclusion that the probability of a Republican respondent voting for Trump in the 2016 Primary did not necessarily depend on his or her stance on those policy issues and therefore provides stronger evidence for strategic voting in the 2016 Republican primary than for substantive voting.4. To be sure, since the data is observational, no casual claims can be made here about the relation between a voter’s primary session and the odds of voting for Trump. While inference to the broader population may be plausible, since the ANES study relied on a representative sample of the U.S. population, the particular timing of the study amid the current political climate and Trump’s unique political appeal may make this result harder to generalize to other Republican primaries. Below we present two figures that capture what we believe to be the central information of our analysis. We used model 4 for both. On the left, a plot shows how the probability of a respondent voting for Trump increased with every Republican primary session held, holding all other covariates constant. The plot on the right shows the same relationship, but splits respondents by their “warmth feeling” towards then-candidate Donald Trump. It can be seen that, for respondents who expressed moderate views on Trump after the primary (50 on a 0 to 100 scale), the total increase in predicted probability of voting for Trump throughout the primary season was highest. They moved from a probability of little under 25% at the start of primary season to a probability of around 50% at the end, again controlling for selected policy, ideological, and demographic variables. This probability increased at a smaller rate for respondents at the extreme of the “warmth feeling” scale (those that highly supported Trump maintained a steady, high probability of voting for him; those that strongly disliked Trump maintained a steady, low probability of voting for him throughout primary season.)
LimitationsAn important comment on the issue of independence is in place here. Since our main explanatory variable depicts positions on a sequence of social learning, the behavior of observations in early positions is, by definition, expected to impact the outcome for observations in later positions. However, we do not consider a specific individual’s vote choice as determinant that impacts the vote choice of subsequent voters, but the collective of the vote choices that influences another observation’s choice later on. Even so, this is issue certainly presents a potential violation of the independence assumption in regression. One other limitation pertaining to our analysis’s internal validity is the possible differing impact of specific election events, which we did not account for in this regression. It could be, for example, that Super Tuesday (#5 in our election sequence variable), had a much stronger effect on voters than previous election events. Admittedly, we did not test for differing effects in this analysis, but such a test would be appropriate to further research. Another limitation stems from the inclusion of only two covariates to test ideological or political affiliation with Trump, wall and sexism. Those could be too limited in scope to serve as parameters for substantive voting. When interpreting our analysis, one should be careful not to go into predictions on candidates’ chances of winning states. Our analysis being at the individual-respondent-level, we cannot draw from it state-level conclusions. As mentioned, that the ANES conducted its study on a representative sample of the U.S. population may ostensibly allow generalizing results to a wider population trend among Republican voters, but we believe this generalization is limited. Time trends and Trump’s uniqueness as a candidate in the history of American politics, should make one careful in extending these conclusions beyond the 2016 primary. Discussion and ConclusionOur analysis leads us to conclude there are stronger evidence for strategic voting in the 2016 Republican primary than for substantive voting. Evidently, binary variables describing potential non-strategic voting considerations had statistically insignificant effects on the odds of a respondent voting for Trump, while the voters’ primary session time was statistically significant in increasing the odds of voting for Trump. Further, when including a ‘warmth feeling’ towards Trump in this analysis, it can be seen that even for respondents who reported disliking Trump (‘warmth’ feeling below 50), the probability of voting for him increased over the course of the primaries, holding all other variables constant. Again, we have to make clear that the results are not a cause-and-effect relationship, but merely a correlation. All in all, our analysis provides evidence that support the strategic voting approach. Further research is still needed to provide a more granular analysis of voters’ decision-making in the 2016 Republican Primary. AcknowledgementThis publication was supported by the Princeton University Library Open Access Fund. References1. Abramson, P.R., Aldrich, J.H., Paolino, P., Rohde, D.W., March 1992. ‘Sophisticated’ voting in the 1988 presidential primaries. 2. Aldrich, J., 1980. Before the Convention: Strategies and Choices in Presidential Nomination Campaigns. University of Chicago Press, Chicago, IL. 3. Aldrich, J.H., Alvarez, M.R., September 1994. Issues and the presidential primary voter. Political Behavior 3, 289-317. 4. American Political Science Review , Volume 79 , Issue 1 , March 1985 , pp.211 DOI: https://doi.org/10.2307/1956146 5. Bartels, L.M., 1988. Presidential Primaries and the Dynamics of Public Choices. Princeton University Press, Princeton, NJ. 6. Ferejohn, John A., and Morris P. Fiorina. 1974. “The Paradox of Not Voting: A Decision Theoretic Analysis.” American Political Science Review 68:525-36. 7. Knight, B., & Schiff, N. (2010). Momentum and social learning in presidential primaries. Journal of political economy, 118(6), 1110-1150. 8. Rickershauser, J., & Aldrich, J. H. (2007). “It’s the electability, stupid”− or maybe not? Electability, substance, and strategic voting in presidential primaries. Electoral Studies, 26(2), 371-380. Endnotes1.) See Appendix for ANOVA tables 2.) See Appendix for equation with included coefficients. 3.) See Appendix for a table with the full set of covariates. The baseline category for income is “income below 20.000.” For education it is “did not finish high school.” 4.) For completeness, we included visualizations of our model by ‘wall’ and ‘sexism’ in the Appendix AppendixSuggested Reading from Inquiries Journal
Inquiries Journal provides undergraduate and graduate students around the world a platform for the wide dissemination of academic work over a range of core disciplines. Representing the work of students from hundreds of institutions around the globe, Inquiries Journal's large database of academic articles is completely free. Learn more | Blog | Submit Latest in Political Science |


