From Clocks and Clouds VOL. 1 NO. 1Increasing Voter Turnout: Can Mass Transit Help?
By
Clocks and Clouds 2012, Vol. 1 No. 1 | pg. 1/1
IN THIS ARTICLE
KEYWORDS
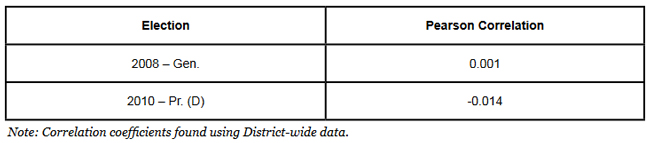
AbstractSince the mid-20th Century, voting rights activists have sought to open the American electoral system and reduce the costs of voting for all citizens. In this study, I look specifically at the impact of polling place localization in relation to mass transit stops on voter turnout rates in the District of Columbia. By compiling precinct-level data on the 2008 General Election and the 2010 Democratic Primary Election and measuring the distance between polling places and the nearest Metrorail station, I am able to determine the extent to which mass transit can lower the cost of voting. Through linear regression analysis, I find that there is no clear relationship between the distance from a polling place to the nearest Metrorail station and voter turnout rates. This study functions as an introduction to the potential voting rights implications of the availability of mass transit near polling places. Despite being unable to reject my null hypothesis in this study, I argue that a convenient mass transit system is capable of reducing the costs of voting among racial minorities and people of low-income status. Literature ReviewThe Cost of VotingThroughout American history, voter qualifications and access to the electoral system have proven remarkably malleable. Perhaps most significantly, the Voting Rights Act of 1965 (VRA) addressed systemic issues of racial discrimination to increase the ability of minority voters to participate in the electoral process. While the VRA's remedial provisions provide for federal oversight in the maintenance of ballot access for all voters, the likelihood for certain demographic groups to participate electorally remains highly unequal. Broadly speaking, studies have indicated a positive relationship between socioeconomic status and voter participation rates (Verba and Nie 1972; Murry and Vedlitz 1977). As measures of socioeconomic status often incorporate data on educational attainment and income levels of population groups, studies investigating these individual components have also demonstrated a significant relationship to voter turnout rates. Specifically, researchers have found that education has a positive effect on voter registration rates and level of political awareness, which translate into higher electoral participation rates (Jackson 1995). Citizens that have achieved a higher level of education are better prepared to navigate the registration process and more likely to gain a sense of satisfaction from voting (Morton 2006). In addition, income as a measure of economic well-being has also been shown to impact voter turnout. For example, in a study on the impact of economic adversity on electoral participation, Rosenstone (1982) finds that high poverty and unemployment levels greatly decrease voter turnout rates. The education and income aspects of a voter's identity impact the specific cost a person must incur in order to vote. Based on statistical analysis, Morton (2006) determines that for most citizens voting is a costly activity, and a rational person would choose not to vote in almost all circumstances. Indeed, according to a registration and election data compiled by the United States Census, citizens expressed a wide variety of reasons for not voting. In the 2008 general election, according to data assembled by the United States Election Project at George Mason University, nationwide turnout among the voting-eligible population (VEP) was over 62 percent. Among the nearly 38 percent of the VEP that did not vote, the most popular reasons for not voting were "Too busy" (17.5 percent), "Illness or disability" (14.9 percent), and "Not interested" (13.4 percent) (U.S. Census 2008). Based on the analysis of literature on this topic, it seems reasonable that these costs can be more easily overcome on an individual basis by citizens that have higher levels of educational attainment and income. Citizens with greater educational and financial resources can overcome the cost of voting, despite illness, disability, or lack of interest because of the more tangible social and "duty of citizenship" benefits (Morton 2006). In other words, more educated citizens are more likely to feel a sense of personal pride and receive respect from their peers in casting their ballot. Also, voters who are experienced in interacting with bureaucratic systems as a result of higher educational attainment, such as university or corporate institutions, are more likely to be able to navigate the voter register process and make it to the polls (Jackson 1995). In addition to the participation barriers cited most by citizens, two other reasons for not voting deserve further consideration: "Inconvenient polling place" (reported by 2.7 percent of the VEP) and "Transportation problems" (2.6 percent) (U.S. Census 2008). Both barriers, while reported by a relatively small percentage of the population, have been studied and found to be relevant concerns in analyzing voter turnout. In a 2005 study on the importance of the location of polling places, Haspel and Knotts (2005) found that "distance [to a polling place] has a statistically significant impact on the voting decision" (567). Similarly, in an analysis of Los Angeles polling places, Brady and McNulty (2011) found that the rate of voting at the polling place decreased as the distance to the polling place increased (124). Again, in a study on the relationship between distance to a polling place and absentee voting, Dyck and Gimpel (2005) found that as distance increases precinct voting drops significantly, while absentee voting by mail greatly increases. As a result, recent efforts to increase voter turnout have focused on increasing the number of polling places (Morton 2006). Ideally, this practice will decrease the distance to a polling place, thus increasing turnout. Other researchers have argued that distance to a polling place is not the only aspect of location that should be analyzed in seeking to explain voter turnout. In 2009, Barreto, Cohen-Marks, and Woods conducted a study of the physical characteristic of polling places in Los Angeles. The researchers distributed a survey to examine the quality of polling places based on eight key criteria, including visibility of the location, availability of parking, and reliability of voting machines. Upon analysis of their data, they found that "low-quality precincts are not randomly distributed across the city and instead are more likely to be found in low-income and minority neighborhoods" (455). Moreover, the concentration of low-quality precincts in communities that are already more likely to record lower voter turnout rates creates a significant voting rights issue (Barreto et al. 2009). While this study discusses precinct quality from a ballot access perspective, it also has implications for voter turnout. Maintaining high-quality precincts, like creating a polling place near a voter's residence, will reduce the cost of voting and thereby increase voter turnout. Indeed, Gimpel and Schuknecht (2003) found that some precincts are more accessible than others, and accessibility makes a significant difference in turnout. However, one feature of the distance to a polling place that researchers have overlooked is the accessibility of the polling place to voters who utilize mass transit services, such as city bus or rail systems. Research shows that there is high demand for mass transit services among low-income and minority residents (Garrett and Taylor 1999). Thus, based on previous research showing an inverted relationship between the distance to a polling place and voter turnout, it is relevant to investigate whether the distance of a polling place from mass transits stations has an impact on voter turnout rates. Furthermore, the ability to access a polling place by way of mass transit, as an additional element of the quality precinct index (Barreto et al. 2009) may reduce the cost of voting to provide more citizens with the opportunity to participate. A Special Case: The District of ColumbiaIn analyzing the relationship between polling place location and voter turnout rates, the District of Columbia provides an interesting case study. The unique political and demographic characteristics of the District of Columbia demand creative solutions to alleviate disparities in electoral participation. Unlike any other local political community in the United States, the District of Columbia was created by the Constitution in order to "be free from any state control so as not to be obstructed in its actions and not to be subjected to any influence contrary to the national interest" (Franchino 1957, 213). As a result of this constitutional provision, residents of the District were not allowed to vote in presidential elections until the ratification of the 23rd Amendment in 1961 (Schrag 1989). Moreover, the District of Columbia did not have representation on the national stage until 1971 when its citizens gained the ability to elect a non-voting, participatory delegate to the United States House of Representatives, and in 1990, a three-member shadow congressional delegation traditionally awarded to territories preparing for statehood (Raskin 1999). Locally, residents of the District of Columbia remained under the absolute authority of Congress until the District of Columbia Home Rule Act was passed in 1973. This act allowed for the election of a mayor and a thirteen-member city council, although Congress maintained "expressly reserved power to stop local legislation from becoming effective" (Schrag 1989, 313). Following these developments in federal representation and local governance, the District of Columbia has engaged in several attempts to enter the Union as a state (Schrag 1989). Today, according to the District of Columbia City Council website, "DC residents seek Statehood because it is the most appropriate mechanism to grant the US citizens who reside in the District of Columbia the full privileges of American citizenship.[including] full voting rights." Thus, the contentious governmental and political situation in the District of Columbia provides a unique atmosphere in which to investigate the institutional costs of voting related to the locations of polling places. Moreover, considering the voting rights implications surrounding the creation of precinct maps, it is important to understand the historical and demographic characteristics of the area. According to 2010 U.S. Census data, the District of Columbia is a racially diverse, yet highly segregated region home to over 600,000 people. In a special U.S. Census report entitled "Demographic Trends in the 20th Century," Hobbs and Stoops (2002) report that "the population in the District of Columbia has been 50 percent or more black since 1960" (92). The combination of a majority black population and complete District-wide disenfranchisement for a significant part of its history serves to illuminate the political climate in which residents of the nation's capital continue to fight for equal voting rights. In fact, despite the relatively recent expansion of voting rights within the District of Columbia, Raskin (1999) argues that due to the city's majority-minority status, the categorical denial of the right to vote for voting members of the United States House of Representatives and Senate "bears an uncomfortable resemblance to political apartheid" (67). Among the eight wards of local governance, the racial and socioeconomic disparities raise valid questions about how the District of Columbia maintains equitable election administration and access to the ballot. For example, 2010 U.S. Census data assembled by NeighborhoodInfo DC show the extreme variance in the presence of certain racial groups, reporting a 96 percent black population in Ward 7 (located in the southeast corner of the District) compared to only a 5.6 percent black population Ward 3 (located in the northwest corner). In general, the white population is concentrated in the northwestern quadrant, while the black population, along with an increasing number of Hispanic people, makes up a majority of the other three quadrants. Similarly, reported annual family incomes vary from over $257,000 in Ward 3 to just more than $44,000 in Ward 8 (located in the southwest corner). In addition, who votes and how they vote can be telling in an investigation into the fairness of election administration and polling place locations. On the whole, the District of Columbia Board of Elections and Ethics (DCBOEE) 2008 General Election registration statistics reports about 427,000 registered voters. By the 2010 General Election, the number of registered voters had increased to over 453,000 people. Registered voters are distributed fairly evenly among all eight wards with the largest variance between Ward 7 (79 percent registered) and Ward 2 (58 percent registered, located in the northwest quadrant). In reporting these statistics, however, it is important to note that Ward 7 claims the second-to-fewest number of residents, while Ward 2 is home to the largest overall population. The absolute number of registered voters per ward varies from over 59,000 in Ward 4 (located in the northeast corner) to about 46,500 in Ward 8. Moreover, political party identification does not differ significantly among wards. In the District of Columbia, 75 percent of all registered voters align themselves with the Democratic Party, and no single ward electorate is composed of fewer than 65 percent of Democratic Party voters. While voter registration rates and political party identification certainly vary from election to election due to population changes and shifts in the political climate, these differences are much more obvious in voter turnout rates. For example, in the 2008 Presidential Election, the candidacy of Barack Obama spurred an increase in turnout in seven of the eight District of Columbia wards when compared to 2004 voter turnout rates (DCBOEE). In 2008, the highest and lowest voter turnout rates differed by just over seven percentage points. In 2004, that number was 20 percentage points. Research DesignThrough analysis of past research, it is clear there a strong relationship between distance to polling places and voter turnout. In addition, the creation of quality precincts can reduce the costs of voting and provide more citizens with the ability to vote. The role of mass transit in the struggle to increase voter turnout and maintain quality precincts has yet to be explored. As previously discussed, the District of Columbia provides a unique case for analysis of electoral questions due to its political status, racial and socioeconomic composition, and electoral system. Moreover, according to a 2009 survey by the U.S. Census, the greater District of Columbia region is home to the third-highest transit ridership among urbanized areas (U.S. Census 2012). This system, which includes Metrorail and Metrobus, is administered by the Washington Metropolitan Area Transit Authority (WMATA). By combining these factors, I designed a research question to examine whether the distance to a polling place from the nearest Metrorail station has an effect on the voter turnout within that specific precinct. I hypothesize that citizens of the District of Columbia are more likely to vote if their polling place is located near a Metrorail station, especially among low-income areas. Thus, the null hypothesis to be tested is that proximity to a Metrorail station has no effect on the rate at which District of Columbia citizens vote. In seeking to test this hypothesis, I designed a cross-sectional case study to compare rates of voter turnout with the distance between polling places and the nearest Metrorail station. To test the independent variable of distance to a polling place from the nearest Metrorail station, I gathered data on the location of polling places from the DCBOEE website and Metrorail stations from the WMATA website. While previous studies on the relationship between distance from a citizen's residence to his or her polling place have utilized Geographic Information Systems (GIS) to calculate precise distance measurements (Dyck and Gimpel 2005; Gimpel and Schuknecht 2003; Haspel and Knotts 2005), I was not able to utilize this technology in conducting my research. Instead, the mapping capabilities of Google provided a user-friendly and cost-effective alternative to GIS software, which allowed me to approximate the walking distance in miles to the polling place from the nearest Metrorail station. Then, in order to create a visual representation of this variable, I plotted the polling places and the Metrorail stations that serve them on a "DC Citywide Ward Map with Precincts" created by the DCBOEE. Based on an initial visual analysis, I decided to aggregate the location data by dividing the data into eight groups to investigate whether different relationships to voter turnout rates exist among the individual wards. Then, considering theories from previous research in conjunction with the U.S. Census demographic data discussed previously, I sought to examine the differing statistical relationships between the two variables among the wards. In order to gain a more representative sample of the recent participation rates in DC elections, I chose to look at data from two elections, including both a general election and a primary election. The 2008 general election, as previously discussed, featured a forty-year high in voter turnout nationwide (United States Election Project). This trend was evident in the District of Columbia election results, as well. With increased participation among statistically unlikely voters, such as blacks and people in lower income brackets, the 2008 general election results potentially exaggerate the overall electoral participation rates of many voters. In other words, characteristics of the political atmosphere in 2008, including the popularity of the candidacy of Barack Obama, likely lowered the cost of voting for many citizens to the extent that mass transit played a less obvious role in turnout rates. On the 2010 primary election day, the DCBOEE administered three party-specific primary elections. Overall, the voter turnout rate for the Democratic Party, Republican Party and the DC Statehood Green Party primaries was just over 37 percent. In order to capitalize on a slightly higher voter turnout rate (at about 40 percent), I chose to focus just on the Democratic primary. Moreover, two unique characteristics of the Democratic primary election made it an interesting case to include in this study. First, the 2010 Democratic primary ballot featured all competitive races, as is often the case for District Democrats, but rarely the case for General Elections and the other parties' primary elections. Second, by considering an election in which only registered Democrats are eligible to participate, the results of the statistical analysis may indicate a partisan divide in mass transit use among District of Columbia voters. The contrasting voter turnout rates, as well as the specific characteristics of each election, provided ample data from which to draw conclusions on the role of mass transit in voter participation. In addition, to limit the voter turnout rate to the voters who actually traveled to their assigned polling place, I only considered the election day turnout as provided by the DCBOEE (excluding those voters who participated via absentee or provisional ballots). The Electoral System of the District of ColumbiaOther factors that must be taken into account in analyzing the relationship between voter turnout rates and the distance from individual polling places to the nearest Metrorail station include the institutional rules and regulations of the District of Columbia electoral system. First, the electoral map is composed of 143 precincts, each with its own polling place. The same polling places were used for both elections considered here. In 2008, the precincts varied in number of registered voters between 581 voters and 5,789 voters. Accounting only for Democratic voters, in 2010, the precincts varied from 443 voters to 4,636 voters. However, the average precinct contains just fewer than 3,000 registered voters for the general election and just over 2,300 voters for the Democratic primary election. The 143 polling places are located in a variety of public buildings throughout the District. Certainly, as Barreto et al. (2009) suggest, the quality of these polling locations varies. Indeed, in measuring the independent variable for this study, I found that the walking distance between the polling place and a Metrorail station varies between 0.09 miles and 2.3 miles. Moreover, the District of Columbia municipal regulations dictate certain rules for participating in an election. Like many states across the nation, the District of Columbia has opened its electoral system to encourage voter turnout and reduce the voting inequities that have historically plagued many jurisdictions. For example, under Rule 3-713, a registered voter is permitted to cast a special ballot at a polling place in a precinct that is not his or her precinct of residence. While a voter casting a special ballot will not be able to declare a preference for ward-level officials or local advisory neighborhood commission representatives, their vote will be counted in federal and District-wide races (DCMR Rule 3-714.13). Because the voters who took advantage of this rule in the 2008 General Election submitted a provisional ballot, they were not included in this study. However, the potential voting rights concerns raised by the accessibility of polling places by way of Metrorail may be somewhat alleviated by these relatively new laws that serve to open the electoral system and decrease the cost of voting. In terms of Primary Elections, the DCBOEE enforces a closed primary system, which means voters can only participate if they are registered with a party preference (DCMR Rule 1-1001.09). In addition, voters are not permitted to change their preference on the day of the election. This regulation is particularly significant in the context of this study because ideally it eliminates cross-over voters from other parties and gives credence to the argument that a partisan divide may exist in mass transit use by voters accessing polling places. Metrorail RidershipA second set of characteristics unique to the institutions analyzed by this research are those surrounding Metrorail. According to the WMATA website, the Metrorail system began operating in 1976. Today, Metrorail features 86 stations on five lines with a total of 106 miles of track (WMATA). In discussing the voting rights implications of the proximity of polling places to Metrorail stations, it is relevant to investigate the demographic composition of the passengers. In June of 2010, WMATA released a report to justify the proposed adjustments to routes and fares throughout the District of Columbia mass transit system. The document, entitled "Title VI Equity Evaluation," uses data from Rail Passenger Surveys as well as the U.S. Census to provide introductory demographic information. According to the report, minority passengers account for 45 percent of Metrorail ridership, while low income passengers account for 14 percent of the ridership. The report also shows that minority and low income passengers make up a far greater percentage of Metrobus ridership, although this aspect of WMATA's mass transit services will not be confronted in this research. Rather, I chose to focus on Metrorail's impact on voter turnout because the abundance of Metrobus stops would diminish the possibility for variable distances to polling places among the precincts. In addition, because the role of mass transit use in increasing access to the polls has not been explored in any capacity, this study sets a benchmark for future research on mass transit by focusing on a single mode of transportation. Statistical AnalysisAfter compiling the quantitative data, I conducted linear regression analyses of the variables for both elections in all eight wards. Other variables mentioned previously, including ward-level demographic data, partisan preference, and electoral competitiveness were considered in a more qualitative manner as they applied to the results of the statistical analysis. FindingsThe two main variables used to conduct this research, the percentage of voter turnout in the 2008 general election and the 2010 Democratic primary election and the distance in miles from polling places to the nearest Metrorail station, produced a wide range of data. In 2008, among the 143 precincts, voter turnout rates varied from a low of 37.3 percent to a high of 64.7 percent. In 2010, turnout rates among Democratic voters varied from 16.9 percent to 64.9 percent. In addition, the highest and lowest distances from polling place to the nearest Metrorail station varied by over 2.1 miles. However, the lower rates of voter turnout did not correlate with the greatest distance from the polling place to a Metrorail station. A bivariate correlation test between the district-wide voter turnout rate and the walking distance from polling places to the nearest Metrorail station produced statistically insignificant correlation coefficient (r) for both the 2008 general election (r = 0.001) and the 2010 Democratic primary election (r = -0.014). Based on this first correlation test, the null hypothesis remains valid, and the proximity of Metrorail stations has no impact on voter turnout rates at the District-level. Based on the regression analysis, none of the wards produced a statistically significant result in support of the rejection of the null hypothesis. Several of the regression coefficients have t-ratios that approach the informal threshold for significance of 2. For example, in 2008, the regression coefficients voter turnout rates in Ward 1 and Ward 2 both have t-ratios over 1.4. Similarly, in 2010, Ward 4 has a t-ratio over 1.4. However, the resulting P-values for every Ward in both elections are extremely high, ranging from 0.16 (Ward 1, 2008 General Election) to 0.897 (Ward 2, 2010 Democratic Primary Election). For reference, if the P-value is greater than 0.05, then the observations occur too frequently by chance to be determined statistically significant. Analysis of the adjusted R-squared values confirms that there is no relationship between voter turnout and polling place proximity to Metrorail stations. The visual representations of the data feature best-fit lines that are essentially horizontal, indicating no discernible linear relationship between the variables in either 2008 or 2010. While previous studies have indicated that the relationship between polling place accessibility and voter turnout is non-linear (Gimpel and Schuknecht 2003), this data does not suggest any alternative relationship. Thus, it is clear that the null hypothesis cannot be rejected.
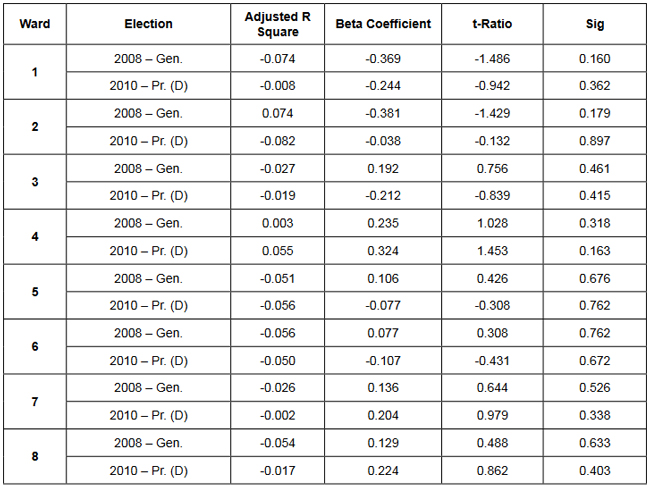
Table 1: Distance to mass transit on precinct voter turnout by ward
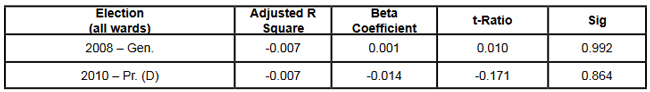
Table 2: Distance to mass transit on precinct voter turnout The inability to achieve statistical significance through linear regression analysis of the relationship between these variables suggests that other confounding variables might have an impact on voter turnout rates in relationship to mass transit ridership. Several potentially explanatory variables are mentioned here as secondary variables, such as demographic data, partisanship, and electoral competitiveness. Upon initial analysis, the relationship (or lack thereof) between voter turnout rates and the distance between polling places and Metrorail stations is not obviously affected by any of the secondary variables in any of the wards. However, if taken out of the context of this particular research question, these secondary variables, particularly demographic characteristics, certainly impact the likelihood of citizens to vote, as well as the likelihood that they use some form of mass transit to get to the polls. Future ResearchWhile this study on the role of mass transit in District of Columbia voter turnout rates proved to be statistically insignificant, there are several aspects of the research design that could be adapted to potentially produce statistically significant results. First, the method used in this case could be applied to another city. The racial and socioeconomic residential segregation and the characteristics of Metrorail passengers in the District of Columbia introduce many secondary variables to this research, as mentioned above. First, and perhaps most significantly, modifying the specific research method used in this study may produce more valid results. For example, rather than relying solely on statistical data, perhaps a survey of actual voters could provide more insight to questions on the relationship between the accessibility of a polling place by way of mass transit and the likelihood a person will vote. The use of statistical data in this study assumes that all voters access the polls by way of mass transit. Realistically speaking, this is not the case, as most precincts are too compact to necessitate use of the Metrorail system for voters travelling from their residences to the polling place. Thus, survey data may provide a better sample for this research question. Moreover, the ease and convenience of using the Metrorail system from the perspective of a college student may not be a universally supported view, and thus, utilizing mass transit would not reduce the cost of voting enough to result in widespread increases in voter turnout rates. In this way, more qualitative data could alleviate bias as a consequence of overarching assumptions. Perhaps a city with a more homogeneous population would provide data capable of exceeding the limit of statistical significance, as racial and economic disparities would have a less obvious impact on voting. Similarly, a geographically larger city with a less concentrated population in which polling places are farther apart or markedly more or less accessible by mass transit may yield more substantive results. In addition, the political situation in the District of Columbia increases the cost of voting by limiting substantial participation of elected representatives within the federal government. In other words, District of Columbia voters who participate in the Congressional elections may get discouraged because they essentially vote for a figurehead who has little power to enact change on their behalf. Finally, the data limits imposed on this study could be alleviated to introduce more cases or explanatory variables. For example, the inflated participation rates in the 2008 General Election could be toned down by including multiple general elections worth of voter turnout rates. Similarly, the complex demographical situation in the District of Columbia could be accounted for by seeking out and including precinct-level racial and socioeconomic data in the final analysis. Controlling for certain demographic groups or employment status may help to refocus the analysis on those voters who use mass transit, rather than simply examining total turnout. Finally, in framing this research question as a voting rights issue, it may make sense to analyze a different form of mass transit that is more frequently utilized by racially and financially marginalized citizens. As previously discussed, WMATA (2010) reported that far more racial minorities and people of lower socioeconomic status use city buses rather than Metrorail. ConclusionWhile the basic statistical results and analysis in this study proved to be largely inconclusive, there is great potential for further research by adapting the methods and data utilized here to produce more significant results. The wealth of past research on the costs of voting and the role polling place location plays in reducing those costs provides a sturdy foundation for additional research on this topic. Specifically, the role that various modes of mass transit play in advancing the mobility of racial minorities and low-income groups to enhance their position within the electoral system should be investigated further. Based on the background information provided in this paper, minority and low-income communities make up a large portion of both the non-voter and the daily mass transit ridership populations. Therefore, if election administrators make an effort to locate polling places along popularly traveled bus and rail routes, it seems logical that voter turnout among traditionally low-voting groups would increase. Although the results of this study suggest that the availability of rail transit cannot explain voter turnout rates, this does not rule out the importance of other forms of mass transit or the significance of mass transit in conjunction with other variables. Analysis of the distance to polling places and voter turnout rates (Dyck and Gimpel 2005; Gimpel and Schuknecht 2003; Haspel and Knotts 2005) suggests that voters, especially members of minority and low-income groups, do not want to take time out of their daily routine to vote. Thus, a polling place positioned at a bus or rail stop near a residential neighborhood should be able to attract voters as they travel to and from work or daily errands. Similarly, voters who are not employed, but use mass transit or live in neighborhoods serviced by mass transit, also should be more likely to vote. Of course, in many cases the characteristics of a high-quality precinct (Barreto et al. 2009), that would further increase participation are severely lacking in minority and low-income neighborhoods. Nonetheless, as voting rights activists attempt to create a more inclusive electoral system, aspects such as creating mass transit-accessible and visible, quality polling places should not be ignored. Much of the current activity surrounding voting rights, especially in the District of Columbia, is centered on increasing both descriptive and substantive minority representation. While this is certainly important in terms of meeting the social and political needs of these communities, increasing minority and low-income groups' participation in the electoral process could arguably be more beneficial. Indeed, the Voting Rights Act of 1965 attempted to provide underrepresented minorities with the right and the ability to elect officials of their choice. However, focusing on creating majority-minority districts that will elect minority officials skews the intent of the 1965 legislation, as there is no guarantee that minority officials will truly represent the rights and interests of minority citizens. Thus, in an ideal world, polling places would be created equal and each voter regardless of the neighborhood he or she lived in would have to incur an equal cost in order to participate in the electoral system. In this way, the discrepancies in voter turnout rates across racial, socioeconomic, and geographical lines would greatly diminish. But, in reality, as researchers continue to consider the questions surrounding polling place location and voter turnout rates, it seems reasonable to consider the institutionalized characteristics of civilized life, such as mass transit systems.
Table 3: Correlation Table References"About Metro." Washington Metropolitan Area Transit Authority. <http://www.wmata.com/about_metro/>. Viewed 18 Apr. 2011. Barreto, Matt, Mara Cohen-Marks, and Nathan Woods. 2009. "Are All Precincts Created Equal? The Prevalence of Low-Quality Precincts in Low-Income and Minority Communities." Political Research Quarterly 62: 445- 58. Brady, Henry and John McNulty. 2011. "Turning Out to Vote: The Costs of Finding and Getting to the Polling Place." American Political Science Review 106: 115-34. "DC Statehood." The District of Columbia. <http://government.dc.gov/DC/Government/Data+&+Transparency/DC+Statehood>. Viewed 18 Apr. 2011. District of Columbia Board of Elections and Ethics. 2008. Monthly Report of Voter Registration Statistics. <http://www.dcboee.org/popup.asp?url=/pdf_files/Statistics_Report_November_2008.pdf>. Viewed 18 Apr. 2011. District of Columbia Municipal Regulations. District of Columbia Regulations. <http://www.dcregs.org/Gateway/RuleHome.aspx?RuleNumber=3-713>. Viewed 18 Apr. 2011. Dyck, Joshua and James Gimpel. 2005. "Distance, Turnout, and the Convenience of Voting." Social Science Quarterly 86: 531-48. Franchino, Roy. 1957. "The Constitutionality of Home Rule and National Representation for the District of Columbia." Georgetown Law Journal 46: 207-59. Garrett, Mark and Brian Taylor. 1999. "Reconsidering Social Equity in Public Transportation." Berkeley Planning Journal 13: 6-27. Gimpel, James and Jason Schuknecht. 2003. "Political Participation and the Accessibility of the Ballot Box." Political Geography 22: 471-88. Haspel, Moshe and H. Gibbs Knotts. 2005. "Location, Location, Location: Precinct Placement and the Costs of Voting." The Journal of Politics 67: 560-573. Jackson, Robert A. 1995. "Clarifying the Relationship Between Education and Turnout." American Politics Research 23: 279-99. McDonald, Michael. 2010. United States Election Project. George Mason University. <http://elections.gmu.edu/Turnout_2008G.html>. Viewed 18 Apr. 2011. Morton, Rebecca B. 2006. Analyzing Elections. New York: W. W. Norton. Murray, Richard, and Arnold Vedlitz. 1977. "Race, Socioeconomic Status, and Voting Participation in Large Southern Cities." The Journal of Politics 39:1064. "Neighborhood Profiles: Council Wards." NeighborhoodInfo DC. <http://www.neighborhoodinfodc.org/index.html>. Viewed 18 Apr. 2011. Raskin, Jamin. 1999. "Is This America? The District of Columbia and the Right to Vote." Harvard University Law Review 34: 39-97. Rosenstone, Steven. 1982. "Economic Adversity and Voter Turnout." American Journal of Political Science 26: 25-46. Schrag, Philip. 1990. "The Future of District of Columbia Home Rule." Catholic University Law Review 39: 311-71. United States of America Census Bureau. 2002. Demographic Trends in the 20th Century. By Frank Hobbs and Nicole Stoops. U.S. Census Bureau. <http://www.census.gov/prod/2002pubs/censr-4.pdf>. Viewed 18 Apr. 2011. United States of America Census Bureau. 2009. Voting and Registration in the Election of November 2008. <http://www.census.gov/population/www/socdemo/voting/cps2008.html>. Viewed 18 Apr. 2011. United States of America Census Bureau. 2012. "Table 1118: Transit Ridership in Selected Urbanized Areas: 2009." Statistical Abstract of the United States: 2012. <http://www.census.gov/compendia/statab/2012/tables/12s1118.pdf>. Viewed March 15, 2012. Washington Metropolitan Area Transit Authority. 2010. Title VI Equity Evaluation. <http://www.wmata.com/about_metro/docs/Title_VI_Equity%20_Evaluation_of_FY2011_Budget.pdf>. Viewed 18 Apr. 2011. From the Inquiries Journal Blog   Related ReadingJournalQuest is a free program to help academic student publications increase online readership and distribution. If you are interested in enrolling a journal at your school, please visit the JournalQuest website. Monthly Newsletter SignupThe newsletter highlights recent selections from the journal and useful tips from our blog. Suggested Reading from Inquiries Journal
Inquiries Journal provides undergraduate and graduate students around the world a platform for the wide dissemination of academic work over a range of core disciplines. Representing the work of students from hundreds of institutions around the globe, Inquiries Journal's large database of academic articles is completely free. Learn more | Blog | Submit Follow IJ
Latest in Political Science |