From The Developing Economist VOL. 1 NO. 1Efficient Pricing of Carbon in the EU and its Effect on ConsumersIII. Computational ModelTo evaluate the efficacy of the carbon tax on the utilization rates of multiple generation technologies, a computation model was created. The model uses a Monte Carlo process in conjunction with a statistical tool known as the Dirichlet distribution to randomly create an array of portfolios, each with a different share of the various generation technologies. These energy portfolios were then evaluated based on their cost and CO2 emissions. Certain thresholds were placed on all portfolios to ensure that they were plausible in the real world, namely that a percentage of power was generated from dispatchables (§2.3). Monte Carlo SimulationMonte Carlo simulations are often used in modeling in situations where a closed-form analytic solution is not readily available or exceedingly computationally intensive. A Monte Carlo simulation relies on repeated random sampling of input variables to obtain an optimal result. In the case of portfolio management (whether it be energy or equities), by randomly choosing the asset allocation percentages and calculating the costs repeatedly, the law of averages states that as the number of simulations approaches infinity, an optimal solution will be found. Dirichlet DistributionIn the proposed model, sampling was done according to the Dirichlet distribution, which ensures that some number of points in a set, n, are randomly sampled such that their sum is equal to some specified total. Thus, the Dirichlet distribution has the statistically appealing property of being the conjugate prior to the parameters of the multinomial distribution. In the computational model, the distribution generates N values, bounded by [0,1] that sum to unity.
Dispatchable Reserve RateAs mentioned in §2.2, grid operators maintain a reserve of dispatchable capactiy based on the fraction of total capacity generated from renewables. Since this is an a posteriori calculation after the desired supply from renewables has been decided, it is calculated in the same manner in the model. The Dirichlet distribution first creates a portfolio consisting of the generation technologies listed in Figure 76 where the sum of the weights equals 1. Afterwards, an algorithm adds the requisite percentage of dispatchable reserves to the portfolio.7 For reserve requirement λ:
Qualification CriteriaOver 20,000 portfolios were generated and stored in a matrix. However, many of these did not meet certain the base load requirement, and were removed. With the remaining portfolios, matrix operations were performed to calculate the cost and emissions. The portfolios that had the highest and lowest cost and CO2 emissions were then kept for each tax rate. *Base Load If energy portfolios did not meet a predefined percentage of power generation from dispatchables (ρ), they were culled from the dataset.
All subsequent qualifications (cost and emissions) are done to include the addition of dispatchable reserves to the portfolio. *Hydroelectric Power Since the amount of power generated from hydroelectric sources is fixed by the number of damable rivers, a limit is placed on the percentage of power that can come from such sources. Research shows that this limit is around 15% of total electric demand.
*Emissions Emissions for each portfolio were calculated by using the weighted average of each generation technology and its respective CO2 emissions (as described in Figure 7). Where ϵi is the CO2 emissions per MWh of generation technology i, wiportfolion i is the weight of generation technology i in portfolion, and CO2portfolion is the total CO2 emissions for portfolio n per MWh.
Costs The costs of each portfolio are tied to the rate at which carbon is taxed and the levelized cost per MWh of each generation technology. Thus, if the portfolio produced more carbon, it would cost more than one that produces less ceteris parabus This is stated mathematically as:
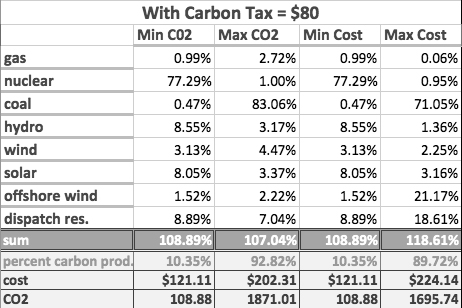
Where costn is the cost of portfolio n and τ is the effective carbon tax rate per tonne of CO2. The tax rate τ was systematically increased and cost recalculated for the same 20,000 portfolios until the portfolio with the minimum cost was the portfolio that had the lowest emissions. This tax rate represents the socially optimal tax rate of §1.1.1. IV. ResultsThe model yielded a final result that matches well with our intuition of what an 'optimal' energy portfolio would look like: nuclear in the place of coal, a diverse mix of renewables, especially hydroelectric8, and supplemental gas turbines for peak demand. It is my belief that wind power is underrepresented in this model because of its intermittency. If a power grid similar to that explained in §2.3.1 is implemented, the capacity factor of wind on a super national level could theoretically be as high as 80% (Airtricity, 2013)9. If the model takes into account this new capacity factor, wind would surely be the dominant resource in the portfolio, as suggested by Gregor Czish in his study of the Supergrid (Claverton Energy, 2009) It is also important to note that these allocations provided do not take into consideration factors such as geopolitical risk of relying on an extra-national energy supply. The study is also run assuming free market conditions with no government subsidies for nor investment price floors for generated power10. Perhaps most importantly, the model does not take into consideration the existing energy mix of the EU. Thus, the relative cost of building new nuclear plants would be higher than using the existing gas turbines and simply paying the tax. In this regard, the model is to be seen as a target for an optimal energy mix of the EU as a whole, not as a blueprint for bolt-on construction. Optimal Carbon PricingThe optimal carbon price is defined as the tax rate at which the cost of of producing carbon is equal to the price of using a renewable source. Thus, the optimal carbon tax rate (τ) is found when the portfolio with the lowest cost first becomes the same as the portfolio with the lowest emissions. By this definition, the optimal tax rate is $80 USD per ton of carbon. Past $80, there is a deadweight loss as no more social benefits are produced in the form of cleaner air yet the cost of production– and therefor consumer prices-increases.
Figure 9: The Optimal Carbon Tax Rate As seen above, the optimal mixture is heavily weighted towards nuclear and hydroelectric power. Confirming out intuition of what would constitute a 'dirty' portfolio, the most polluting portfolio uses coal as its primary energy source (83%). In the spirit of the taxation, at a tax rate $80, the most expensive portfolio is also heavily weighted towards coal (71%). The Effect of Renewables on Consumer Utility PricesFor measures such as the European Supergrid to pass, ultimately the voters will have to approve measures that will raise their taxes. In today's economic climate this will prove difficult, it not impossible, unless consumers can be shown that they will benefit in the medium to long term in the form of lower utility prices. Currently, the average price for electricity in the industrial sector11 in the nations studied is around 97 Euros per MWh (Europe's Energy Portal, 2013). Converted to US dollars at current exchange rates, this price is around $132 per MWh. Including an average profit margin for utility providers of 3% (Yahoo! Finance, 2013), the cost of the portfolio suggested by this model is $125 per MWh. With a margin of error of plus or minus 5%, these results imply that a Europe with reduced emissions can be achieve at a similar, if not lower, price than currently facing households. The data produced by this model is confirmed by the research of Gregor Czish (Claverton Energy, 2009) If cleaner air won't motivate consumers, surely this will. V. Future ImprovementsThis model will be expanded in the future to consider the location of the power plants suggested by this model. Population dynamic considerations such as population density and population growth will motivate the location of power plants, as will physical factors such as line losses from HVDC transport and local distributive capacity. The future model will also take into consideration the existing mixture of energy resources currently in place in Europe to provide a guideline for which type of power generation the EU should invest in– and in which order– to achieve maximum reduction in emissions at the minimum cost. * References
Endnotes
This article was published in A publication of University of Texas at Austin 
From the Inquiries Journal Blog   Related ReadingJournalQuest is a free program to help academic student publications increase online readership and distribution. If you are interested in enrolling a journal at your school, please visit the JournalQuest website. Monthly Newsletter SignupThe newsletter highlights recent selections from the journal and useful tips from our blog. Suggested Reading from Inquiries Journal
Inquiries Journal provides undergraduate and graduate students around the world a platform for the wide dissemination of academic work over a range of core disciplines. Representing the work of students from hundreds of institutions around the globe, Inquiries Journal's large database of academic articles is completely free. Learn more | Blog | Submit Follow IJ
Latest in Economics |