Featured Article:The Effect of Dodd-Frank on the Profitability of Community Banks: An Econometric Model
By
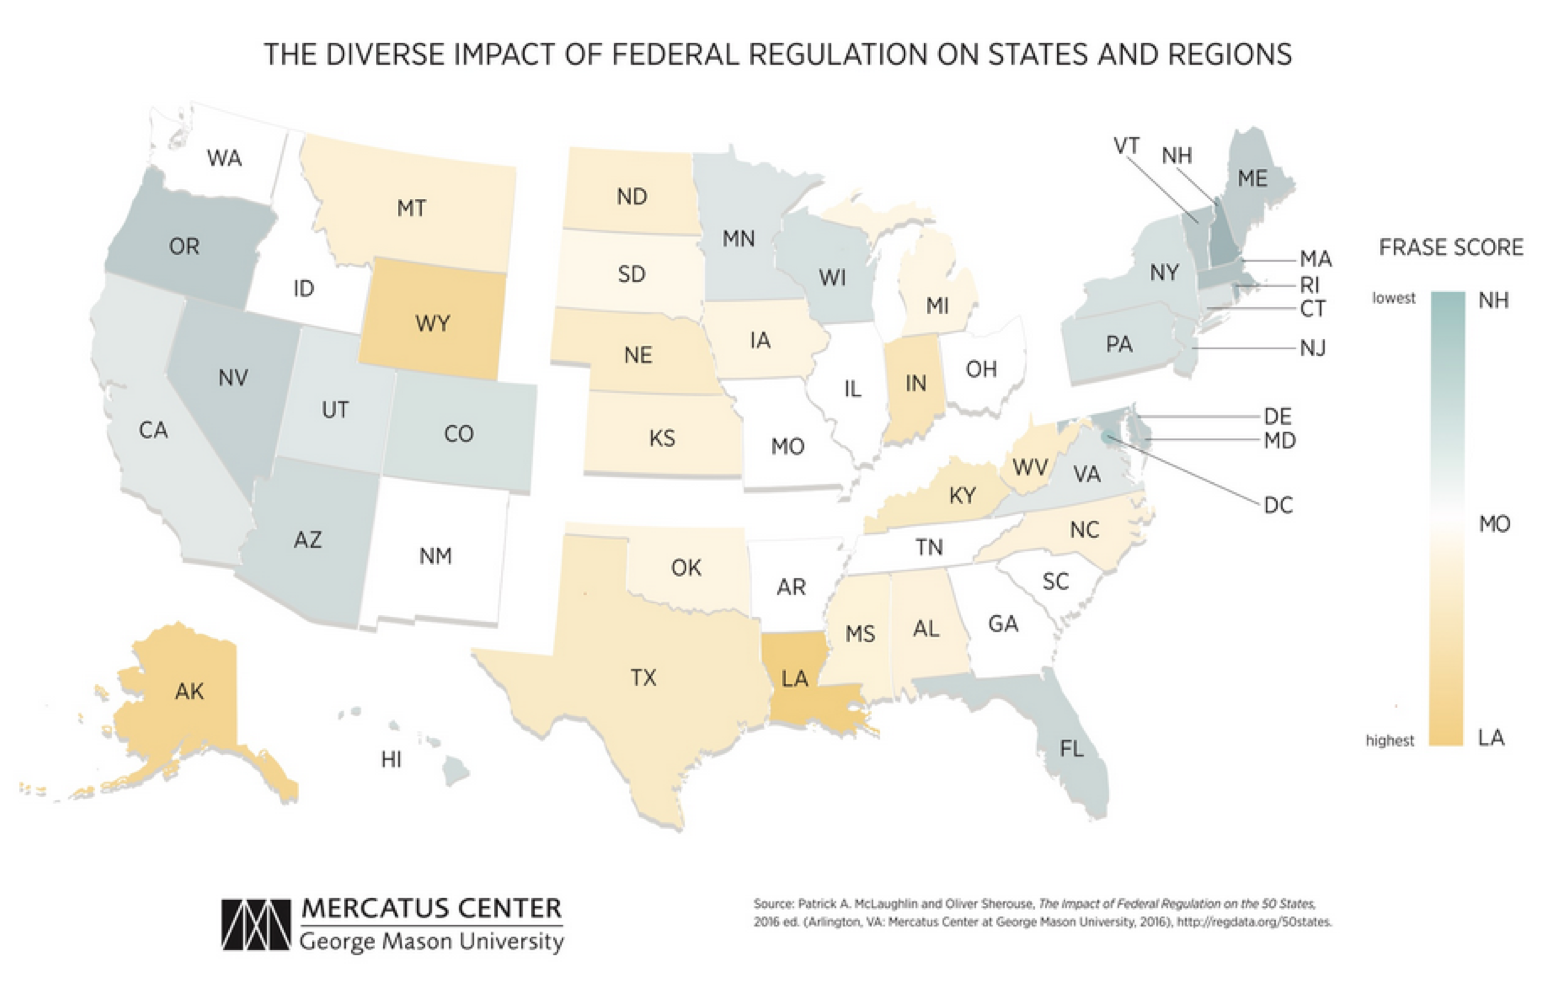
2017, Vol. 9 No. 02 | pg. 1/2 | » AbstractThis study examines the effects of the Dodd-Frank Act on community banks in the Northeastern region of the United States. Using annual financial data from years 2010 to 2014 gathered on 82 banks, a regression equation is estimated using the Generalized Method of Moments (GMM) technique described by Arellano and Bover (1995). The dependent variables are return on equity, return on assets, and net interest margin. The independent variables can be placed into the three categories: regulation determinants, profitability variables, and macroeconomic indicators. The results indicate regulations have an impact on the profitability of banks, and that the smaller a bank is, the less profitable it will be. This suggests that the Dodd-Frank Act has impacted community banks’ profitability. The findings also indicate that bank profitability is negatively impacted by non-performing loans, cost efficiency, the growth of total deposits, and the FRASE index. Bank profitability is positively impacted by credit quality, assets and real GDP growth rate. The Dodd-Frank Wall Street Reform and Consumer Protection Act of 2010 was created in response to the financial crisis of 2008 in order to abate poor practices performed by large banks that were deemed “too big to fail.” The issue to be addressed is the effect of the Dodd-Frank Act on community banks. This topic has been previously unexamined econometrically, and has only been explained through anecdotal and survey-based research. There is survey-based evidence that community banks are unnecessarily strained by the new compliance requirements imposed by the Dodd-Frank Act. This research is essential to help regulators understand how the Dodd-Frank Act is affecting bank’s profitability. Americans need to understand how these laws are affecting banks and, therefore, affecting availability of loans for homes, cars, and small businesses. The financial crisis of 2008 is considered the worst financial crisis since the Great Depression of the 1930s. Many different things happened to create the environment in 2008. Subprime lending was abundant. Mortgage lenders were lending money for overinflated house prices to borrowers that were not financially stable. Also, many financial institutions started to fail and required government bail-outs. The Dodd-Frank Act was signed into federal law on July 21, 2010 by President Barack Obama. It has been called the most significant law of bank regulation since reforms following the Great Depression.The American Bankers Association (2012) outlined twelve important points that the Dodd-Frank Act changes in the banking industry. Some of these changes, such as the change to swaps and savings and loan companies do not apply to small community banks. The most important changes that could potentially impact community banks include: Consumer Financial Protection Bureau (CFPB), FDIC coverage and assessment base, and mortgage financing. The Consumer Financial Protection Bureau is an agency that was established to identify and prevent potential issues with consumer products. The CFPB implemented new rules on recordkeeping which hold the potential to pressure banks to hire additional compliance staff in order to meet the new regulations. The Dodd-Frank Act made a change to the FDIC and raised its insurance limit to $250,000 from $100,000. Whenever there is an increase in insurance coverage, premiums rise. Some banks saw reductions in premiums while others saw increases. The hard cap on the size of the fund was eliminated, and this could mean higher premiums in the future. Finally, new restrictions on lending practices and loan terms have been put into place. The Dodd-Frank Act has changed almost every regulation regarding mortgage financing, which means that banks will need to institute different lending systems and processes. As a result, banks may come to find that the new regulations make consumer mortgage financing too costly to offer. As one of the first papers to explore this topic econometrically, the aim is to ascertain whether or not the Dodd-Frank Act has had an adverse effect on community banks. This will help policymakers understand its implications, and resolve the problems before the United States’ economy loses a vital part of an industry that drives growth. Outline of PaperThis study attempts to determine which financial factors play a significant role in explaining the return on equity, return on assets, and net interest margins of the selected banks. The second section will review existing literature that investigates the effects of the Dodd-Frank Act on these banks. Data and variables used in this study will be discussed in the third section. The econometric model and methodology will be explained in the fourth section. The regression equation and results will be discussed in the fifth section. Finally, conclusions and extensions of research will be discussed in the last section. Literature ReviewDietrich and Wanzenried (2011) investigated bank profitability before and during the financial crisis of 2008. The periods in the study are pre-crisis (1999-2006) and mid-crisis (2007-2009) for 372 commercial banks in Switzerland. Using the generalized method of moments (GMM) estimator, Dietrich and Wanzenried (2011) analyzed profitability by Return on Assets (ROA), Return on Equity (ROE), and Net Interest Margins (NIM) and its relationship with bank-specific, macroeconomic, and industry-specific determinants. The overall results of this study suggested that the crisis did have a significant impact on bank profitability in Switzerland. Naceur and Omran (2011) studied the influence of bank regulations on commercial bank margins. They utilized the GMM technique to estimate their model on a panel dataset. Their dependent variable, the natural log of net interest margin was lagged one period. The panel consisted of 16 years of data on 173 banks. They found that bank capitalization and credit risk have a positive and significant impact on banks’ net interest margins, cost efficiency, and profitability. This paper found that macroeconomic and financial development variables had no significant impact on the dependent variable, except for inflation which had a negative impact. Athanansoglou, Brissimis, Delis (2008) used bank-specific, industry-specific and macroeconomic determinants to study bank profitability. The Greek banks were studied from 1985 to 2001 using the GMM technique. The dependent variables, Return on Assets (ROA) and Return on Equity (ROE), were lagged one period. All bank-specific variables were found to affect profitability. These variables include: capital, credit risk, productivity, and expense management. In addition to these variables, control variables were used including: inflation, interest rates, cyclical output, industry size, and market concentration. The Herfindahl-Hirshman index was used to account for market concentration of the banking industry. Consistent with Athanansoglou et al. (2008), Ozkan, Cagnur, Varan (2014) used the Herfindahl-Hirshman index and macroeconomic control variables and capital variables. In contrast to their paper, Ozkan et al. (2014) used total loans and non-performing loans as well as ROA as dependent variables. Kanas, Vasiliou, Erotis (2012) analyzed U.S. bank profitability using a semi-parametric approach to uncover the effects of certain variables. These variables included monetary policy, bank loan portfolio, and diversification of bank income. This studied used Return on Assets and Return on Equity as the dependent variables. The paper found that the change in loan portfolio was significant in both models, while the change in short-term interest rate was significant at the 5% level, diversification was only significant at the 10% level in the return on asset model. According to Pierce and Miller (2015), in the 2000-2014 period there has been a 33% increase in large banks and a 28% decrease in small banks (categorized by banks with $10 billion or less in assets). Since the passage of the Dodd-Frank Act (2010-2014) there has been a 13.8% decrease in the number of banks in the United States. Further investigation into the decrease shows that there was a 14.1% decrease in small banks, with a 6.3% increase in large banks. Lux and Greene (2015) analyzed the trends in community banking such as lending patterns, consolidation, and post-crisis performance. They used information from the FDIC Statistics on Depository Institutions to find the market position of community banks relative to the five biggest banks in the U.S. and other banks. It showed that 77% of agricultural loans and 51% of small business loans came from community banks. From 1994 to 2014, the share of the lending market for community banks fell from 44% to 22% in 2014. This demonstrated that community banks play an important role in the United States economy as small businesses create a majority of jobs. The paper offered explanations for the market share decline, including consolidation and post-crisis performance. The number of community banks has decreased in recent years which could be due to consolidation and mergers. DataThis study examined panel data for 82 banks in the Northeast region of the United States to determine profitability. Appendix A includes a list of the 82 banks that are being used in our study along with what state they are headquartered in and whether or not they classify as community banks. The sample is comprised of financial performance indicators for 2010 to 2014 in order to measure the impact of Dodd-Frank from its implementation to the presently available data. The data for this study was acquired using Bloomberg (2015) software as well as data from the Federal Reserve Economic Data (U.S. Bureau of Labor Statistics and U.S. Bureau of Economic Analysis) and the Federal Deposit Insurance Corporation (2015). The data have been sorted into three categories: regulation variables, profitability determinants, and macroeconomic indicators. Appendix B reports the correlation matrix. Bank portfolio and interest income share are correlated, which may be because they both deal with interest on loans. Inflation and RGDP are also correlated. In order to measure Dodd-Frank’s impact on banking, this study uses three separate dependent variables: return on assets (ROA), return on equity (ROE), and net interest margin (NIM), which follows Dietrech and Wanzenried (2011). Return on assets is net income divided by average assets for that year. In general, return on assets indicates a company’s abilities to make profit given its assets. Return on equity is net income divided by common equity. This is the amount of profit available to common stockholders, and it serves as a measurement for management’s ability to create wealth for stockholders. Net interest margin is a performance metric that measures the difference between interest generated by sources of income and the amount of interest paid out to lenders, such as bank depositors. Appendix C summarizes the definitions of each variable along with their expected signs. Independent Variables and Expected SignsRegulation DeterminantsThree variables are used to account for community bank status. The other variables (ASSETS) and (LOGASSET) are used to account for the size of the bank’s assets. According to Naceur and Omran (2011), there is a non-linear relationship between size and bank performance. Dietrich and Wanzenried (2011) theorize that the larger banks are, the more than likely they are to have a higher degree of production and loan diversification. One variable (FRASECUR) is used to account for how federal regulation affects each state with a one year lag. Al-Ubaydi and McLaughlin (2015) created the FRASE Index that allows the size and scope of the Dodd-Frank Act to be quantified. A FRASE score of 1 means that federal regulation affect a state to precisely the same degree that they do the nation as a whole. Correspondingly, a score lower than 1 means regulation affects the state less than the nation, and a score of more than 1 means regulation affects the state more than the nation. The Northeast in general has a low FRASE score (see map in Appendix H). Profitability DeterminantsProfitability determinants were decided upon based on the literature. The variables include: total deposit growth (TOTDEPG), interest income share (INTINCESHARE), diversification (DIV), cost efficiency (COSTEFF), credit quality (CREDITQUAL), bank portfolio (BANKPORT), and non-performing loans (NPLG). Total deposit growth (TOTDEPG) is the percentage change over a one-year period of total deposits. In order to lend money and make revenue through interest and fees, banks need a supply of deposits. In this case, profitability would be positively correlated to total growth of deposits. However, Dietrich and Wanzenried (2011) explain that it is not as simple as obtaining deposits and creating revenue. A bank’s operating efficiency is how well they convert deposits into loans. A bank’s credit risk is how many high quality loans they issue. Operating efficiency and credit risk will play a role in a bank’s ability to generate revenue. Therefore, total deposit growth variable’s sign is ambiguous and might be better determined econometrically. Interest income share (INTINCESHARE) is a percentage of interest-based income divided by non-interest income. This variable’s sign is ambiguous because traditionally banks have focused on interest income to make a profit; however, recently, non-interest income has become a more important vehicle for profit. According to Pierce, Robinson, and Stratmann (2014), 27% of the surveyed respondents indicated their bank fees rose. One caveat is that Dodd-Frank requires banks to reduce debit interchange and overdraft fees. It is not known to what extent other fees rose to counteract that reduced income. Dietrich and Wanzenried (2011) have determined that margins on non-interest income are higher than on interest income, especially in low interest rate environments. Another variable that uses income to determine profitability is diversification. Diversification (DIV) is similar to interest income share in that it uses interest and non-interest income in its calculation. This variable’s sign is ambiguous for the same reasons interest income share’s expected sign is ambiguous. The cost efficiency (COSTEFF) variable takes a look at how operating efficiency translates into profitability. The variable is calculated by taking total operating expenses divided by revenue and deposits. Better management will raise revenues and mitigate expenses, thus it is expected to be negatively correlated with profitability. Athanasoglou, et al. (2008), used this variable to account for the efficiency of a bank. Marsh and Norman (2013) theorize that the Dodd-Frank Act has impacted community banks by means of increased expenses. The Risk Management Association’s (2015) survey on community banks found that 90% of banks surveyed stated that the cost to comply has risen 10%, with 38% of them indicating that the cost of compliance has risen 26% or more (2015). Credit quality (CREDITQUAL) is used by Athanasoglou, et al. (2008) to account for the increased exposure to credit risk a bank may take on. It is theorized that this variable’s sign will be negative because if a bank has a large reserve for loan losses, the bank is taking on a lot of risk and may need to charge-off loans in the future which will negatively impact profitability. The loan loss provision may be affected by the Dodd-Frank Act due to regulations which require banks to keep a higher provision for losses. Two variables that account for the types of loans a bank holds are bank portfolio (BANKPORT) and non-performing loans (NPLG). The bank portfolio variable was used by Kanas, et al. (2012) to determine if consumer loans or commercial loans are more profitable. According to the Risk Management Association (2015), 76% of surveyed community banks indicated that their institutions planned to increase commercial and industrial lending within the next 24 months. This could be an effect of the Dodd-Frank Act because commercial lending is not as stringent as consumer lending and does not require the addition of compliance costs. Finally, non-performing loans are taken into account to measure the asset quality a bank holds. Ozkan, et al. (2014) used non-performing loans as their dependent variable to proxy for bank performance. Non-performing loans are loans that are in default and not accruing interest and therefore not making the bank money. The purpose of the Dodd-Frank Act was to create a banking environment that had fewer “bad” loans and debt. This variable’s coefficient is expected to be negative, implying that there will be fewer loans that are not accruing interest. Macroeconomic IndicatorsThe macroeconomic indicators serve as control variables to ensure that trends in the industry and the economy are accounted for in the model. The national economy affects profitability of banks because consumers and companies are more likely to use bank services when the economy is doing well. These variables include: consumer price index (CPI) is the percent change for all urban consumers in the Northeast lagged one period. Naceur and Omran (2011) found that inflation was the only significant macroeconomic indicators to bank performance. The percent change in real gross domestic product (RGDP) and the 30-year interest rate (INTRATE) lagged one year are also used. This study includes the Herfindahl-Hirshman index (HHI) which was calculated for each state and each year using the FDIC (2015) market share data. Dietrich and Wanzenried (2011) found that the index is significant and positive on bank profitability before crises but not after. This variable accounts for the amount of competition in each state and the concentration in the market. On one hand, higher concentration would theoretically help profitability, whereas on the other hand, more competition may hinder profitability. Hence, this variable’s sign is ambiguous. Descriptive StatisticsAppendix D outlines the descriptive statistics for each variable including the three dependent variables. The average return on assets is 0.71. This means for every dollar in assets their income is $0.71. The average return on equity is 6.73, which translates to every common stockholder recieving $6.73 of net income. Finally, the average net interest margin was 3.46. In other words, for every asset that is considered to be earning company money, there is $3.46 of interest income. In addition, there are a few outliers worth noting. The largest non-performing loan loss provisions were taken by Suffolk Bancorp in New York in 2011. Their loan loss provision came in at 1,871 which is much greater than the average of 5.78. In 2011, their loan loss provision was 4.3% of their total loans. This provision was taken in 2011 to help their balance sheet and protect against future charged-off loans. The largest Herfindahl-Hirshman index was in Maine in 2013 with an index number of 1,740. The smallest was in Connecticut in 2010 with an index number of 476.11. These index numbers are out of 10,000 with 10,000 being a monopoly market. Econometric ModelFive separate models were run for three different dependent variables: return on equity, return on assets, net interest margin. In order to test the hypothesis, the Generalized Method of Moments (GMM) estimation technique was used to examine the parameters as described in Arellano and Bover (1995), with the classical assumption that the errors are normally distributed. The use of a panel dataset is used to control for the unobserved heterogeneity across cross-sectional units. The empirical results of each model with the three dependent variables, ROE, ROA, NIM are summarized in Appendix E, F, G, respectively. The Wald-test indicates a goodness of fit that is accepted in all models. The Generalized Method of Moments (GMM) estimator accounts for endogeneity within the model by using lagged values of the dependent variable in levels and in difference of instruments, as well as lagged values of other regressors which could potentially suffer from endogeneity following Dietrich and Wanzenried (2011). According to Naceur and Omran (2011), who cited Arellano and Bover (1995) and Blundell and Bond (1998,) the GMM system is used to remove the unobserved fixed effects by taking the first difference in the equation, independent variables are instrumented using lagged values of the regressors and the equation in first difference levels are jointly estimated. The system is tested using the Hansen test of over-identifying restrictions and a test of the absence of serial correlation of the residuals. Autoregression is found when a variable is influenced by its own value in previous periods. For ROE, ROA, and NIM the only models that reject the second-order autocorrelation by the test for AR (2) errors are model 3 and model 5 for ROA. All other models may have autoregression and results may reflect that. The Levin, Lin, and Chu test for unit roots found that all of the variables rejected the null of unit roots. The Breusch-Pagan Test for heteroskedascity was conducted and it was concluded that the data is homoskedasctic. Model 1 of all dependent variables was run using all independent variables while model 2-5 are differenced by one period. Model SpecificationTo empirically examine the panel data set of 82 banks over the years 2010-2014 the general model to be estimated is as follows (1):
This is following the form of Athanasoglou, et al. (2008). C is the constant term and is the disturbance term. is the profitability of a bank i at time t, with i =1,…,N, t = 1,…,T. are the explanatory variables in the equation. ResultsThe Northeastern banking sector can be considered an almost perfectly competitive market system because the return on assets is larger than net interest margin. The coefficients are Return on Equity, -0.22, Return on Assets -.11, and Net Interest Margin -0.14 at the 1% significance level. If the return on equity and the return on assets were larger than the net interest margin it would be considered a perfectly competitive market. As interest rates rise, profits will be greater than the spread on interest. Regulation VariablesAssets (ASSET), assets squared (ASSET2) and the log of assets (LOGASSET) were used as proxies for bank size. Assets were significant and positive, but extremely small for return on equity. Naceur and Omran (2011) and Athanasoglou, et al. (2008) confirm that that although this variable is significant, it is not large enough to have a profound impact on profitability. The log of assets was significant and positive for net interest margin. Naceur and Omran (2011) found that there is an effect on banking size and net interest margins also. The FRASE index is significant and negative with profitability. This indicates that as there is more regulation in a state, the less profitable a bank becomes. This directly concerns the Dodd-Frank Act and gives evidence that it does in fact affect profitability. It is also one of the largest coefficients in determining profitability, along with cost efficiency. Profitability VariablesThe cost efficiency (COSTEFF) variable is significant and negative for the dependent variables ROA and ROE. This shows that an efficient bank is more profitable. These findings are in line with Dietrich and Wanzenried (2011) and Athanasoglou, et al. (2008). The credit quality (CREDITQUAL) variable is significant and positive for the ROA and ROE dependent variables. This is in contrast to other literature by Athanasoglou, et al. (2008) and Dietrich and Wanzenried (2011). Their findings were negative. However, a positive credit quality variable could make sense because higher quality loans make banks more profitable. Growth of total deposits (TOTDEPG) is significant and negative for ROA and ROE. This is in line with Dietrich and Wanzenried (2011). When a bank has growth in deposits, it takes time for this to be converted into loans and therefore profits. The Dodd-Frank Act requires banks to hold a large portion of high quality liquid assets. An example would be cash deposits. If they have to hold these cash reserves then they are not being converted into profit generating loans. Interest income share (INTINCSHARE) is positive and significant, but small for return on assets. This is in contrast with Dietrich and Wanzenried (2011) who found interest income share to be negative. Banks with a high share of interest income tend to perform worse than banks that do not especially in an environment of low interest rates, profitability comes from non-interest income. Another variable that takes this into account is diversification (DIV). Diversification has mixed empirical evidence in literature. In this study, it was not significant for any of the dependent variables. This is consistent with Kanas, et al. (2012) who did not find significance in their semi-parametric model. Bank loan portfolio (BANKPORT) take into account the changes in commercial loans to consumer loans. This is significant and negative, but has a small impact for return on equity. Kanas, et al. (2012) found that commercial and industrial loan changes affect profitability in a non-linear manner. For example, a reduction in commercial and industrial loans negatively affects profitability, however, an increase doesn’t affect profitability. The small impact found in this study could be capturing this effect. Non-performing loan (NPLG) have a negative and significant effect on profitability. This sign makes sense because non-performing loans are put in non-accrual and do not create wealth for the bank, rather they take up resources and potentially cut into profitability. Macroeconomic VariablesBank concentration in the form of the Herfindahl-Hirshman index was not significant in this research for any of the dependent variables. Other studies conclude that market concentration tends to be negative for profitability. The small sample size of this study could be a reason that the Herfindahl-Hirshman index is not significant. The interest rate (INTRATE) is significant and negative for all three dependent variables indicating that the thirty-year interest rate impacts profitability and the interest spread. This may be misleading because it has a negative sign however, this data is the change year-over-year for the period 2010-2014. During these years, the interest rate changed very little and went down over the years. A longer period of data needs to be examined to fully understand how interest rates affect bank profitability because conventional theory states that a larger interest rate would give banks a larger profit margin. The change in real GDP (RGDP) is significant and positive to profitability which is in contrast to Naceur and Omran (2011) who found no impact. However, it is reasonable to suggest that as the United States productivity goes up, bank profitability also increases. Inflation (CPI) is negative and significant for net interest margins. This is in contrast to Athanasoglou, et al. (2008) who found a positive impact. Naceur and Omran (2011) found a negative impact. This could be because banks are not accurately forecasting inflation which could be true because the Federal Reserve has been predicting 2% inflation for the last several years and has not reached it.Continued on Next Page » 
From the Inquiries Journal Blog")   Monthly Newsletter SignupThe newsletter highlights recent selections from the journal and useful tips from our blog. Suggested Reading from Inquiries Journal
Inquiries Journal provides undergraduate and graduate students around the world a platform for the wide dissemination of academic work over a range of core disciplines. Representing the work of students from hundreds of institutions around the globe, Inquiries Journal's large database of academic articles is completely free. Learn more | Blog | Submit Follow IJ
Latest in Economics |