The Value of a Graduate Degree: Changing Returns to Postgraduate Qualifications in the UK
By
2014, Vol. 6 No. 09 | pg. 1/2 | »
IN THIS ARTICLE
KEYWORDS
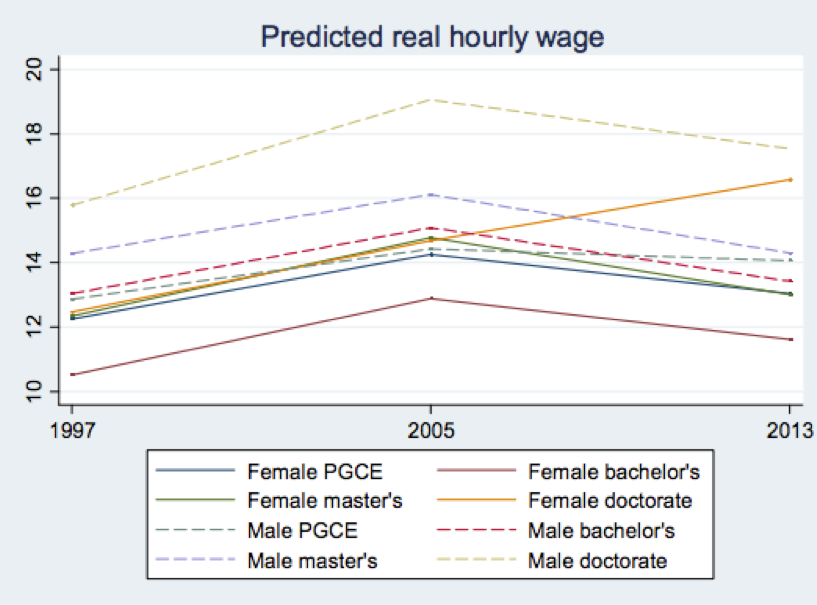
Higher education in the UK has experienced radical change over the last two decades. As a result of the increased supply of university graduates, bachelor’s degrees no longer function as a good signal to employers and more individuals are therefore pursuing postgraduate study to make themselves more competitive in the job market (Katz and Murphy, 1992; Lindley and Machin 2011, p. 1). Today, about 11% of working people aged 26-40 hold a postgraduate qualification compared to just 4% in 1996 (Lindley and Machin 2013a, p. 3). In part this increase may be attributable to the economic uncertainty created by the financial crisis in 2008 (Lipsett, 2009), but the greater demand for postgraduates may also be due to rapid technological change that has necessitated more highly educated individuals (Lindley and Machin 2013b). Meanwhile, as the relative wages of postgraduates has risen compared to holders of a first degree, increasing within-graduate inequality has become apparent (ibid, p. 26). Differing returns to education matter not only because of our assumptions about the value of a degree, but also because they are connected to social mobility (Lindley and Machin 2012, 2013a, p.5, Machin and Van Reenen 2007, p.10). While a substantial body of literature considers the increasing returns to postgraduate qualifications (e.g. Lindley and Machin, 2011, 2013a, 2013b; Walker and Zhu 2005), this paper decomposes the returns to postgraduate qualification by the type degree or qualification and by examining how these returns have changed since 1997. Using recent data we find, in contrast to some research (Walker and Zhu, 2005), that irrespective of gender the real returns to a bachelor’s degree have fallen, along with returns to a master’s degree and a postgraduate certificate in education (PGCE). On the other hand, returns to a doctorate rose over time. 
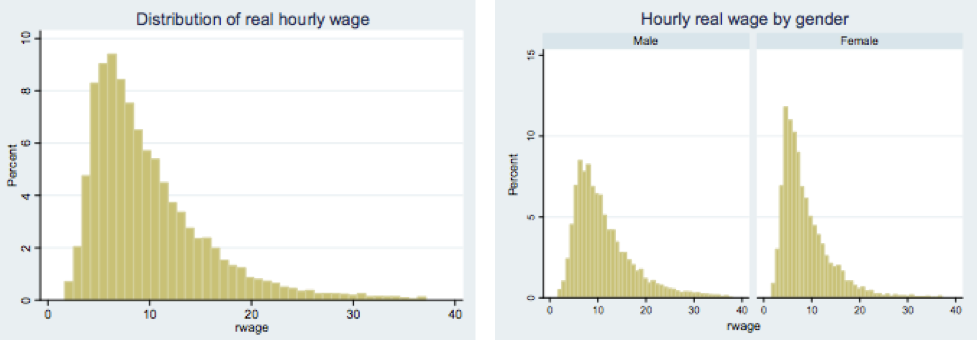
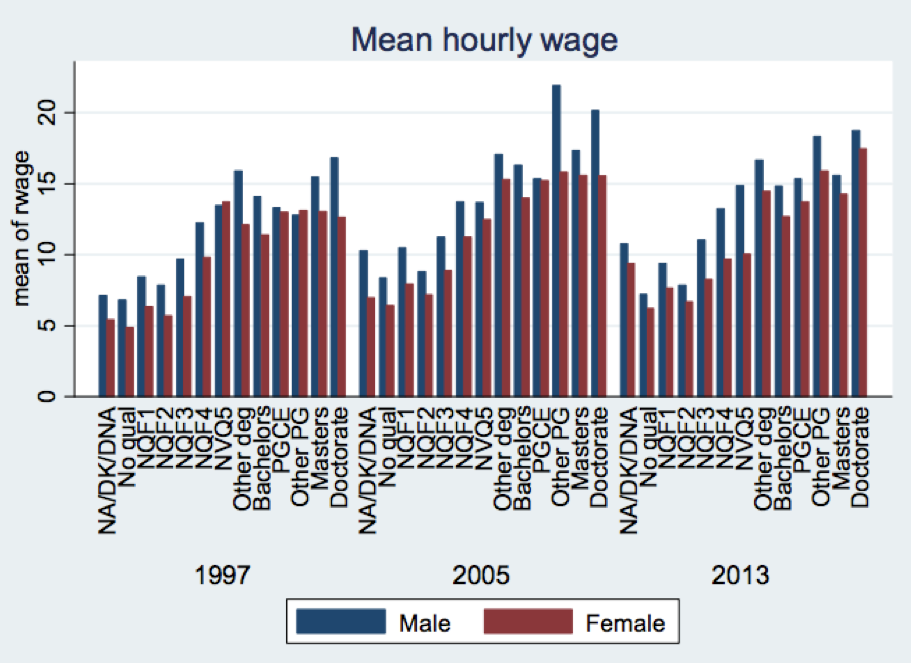
We find that the returns to both Bachelor’s and Master’s degrees have fallen over the years, while doctorates continued to drive increasing returns to wage earners. Data and Summary StatisticsWe use pooled cross-sectional data from the Quarterly Labour Force Survey in years 1997, 2005 and 2013. We take wave one individuals from Q2 (April – June) and condition our analysis on (i) employed individuals (employees or self-employed) who are (ii) aged over 25 (so likely not still in education), (iii) without a health problem that limits the amount of work they can do and (iv) who record an hourly wage in the middle 98% of the distribution. We construct the real wage using CPI data, using base 2005=1. Our resulting sample consists of a total of 18,506 individuals: 7,405 from 1997, 6,216 from 2005 and 4,885 from 2013. The proportion of individuals who undertook postgraduate study grew over the three periods: 4.38% in 1997, 7.16% in 2005 and 10.05% in 2013. These figures correspond remarkably closely to Lindley and Machin’s estimates above (2013a p. 3). The mean real hourly wage is £9.97 with a standard deviation of 5.73. The minimum is £1.67, falling below the official minimum wage due to individuals working more than their officially contracted hours. The maximum is £37.17. Figure 1 graphs the distribution of real hourly wage 1 (rwage). There are 8,938 male and 9,568 females in our sample with mean real hourly wages of £11.24 (s.d. 0.64) and £8.79 (s.d. 0.05) respectively. Differential earnings by gender are a feature of the literature (Lindley and Machin, 2011) and widely acknowledged, so the difference in means across genders is tested and significant at the 1% level. Figure 2 shows the distribution of wages by gender: the male distribution is more platykurtic with more individuals at higher values of the wage distribution; the female distribution is more leptokurtic, peaking below £10 per hour. Figure 3 shows how these gender differences persist through each year and almost every qualification level. Figures 1 & 2
Figure 3
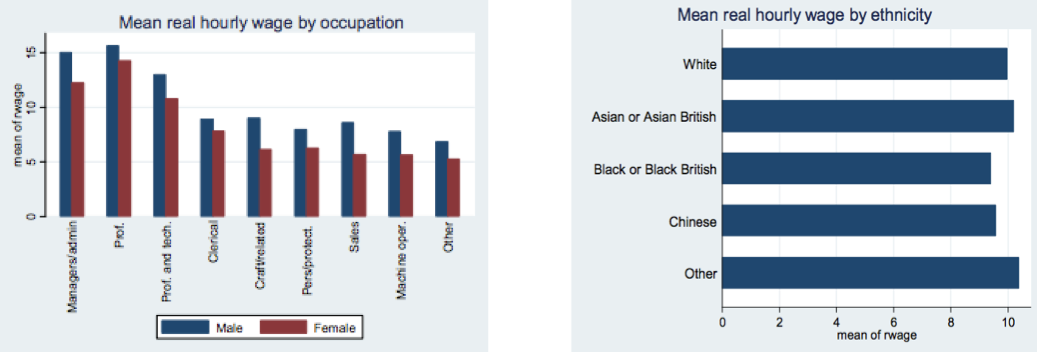
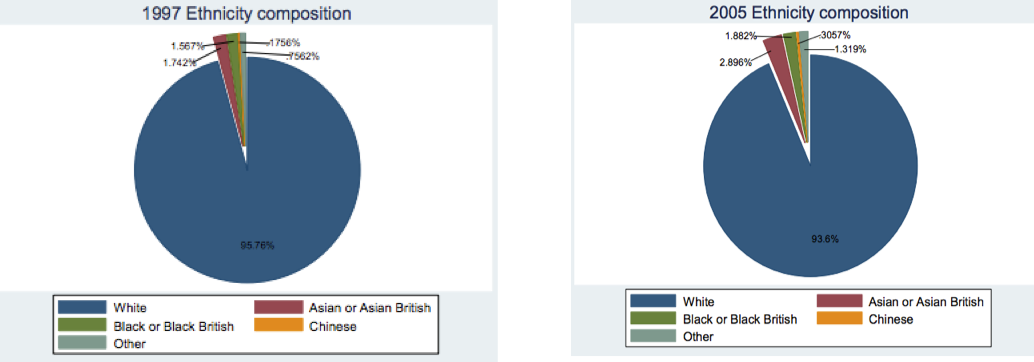
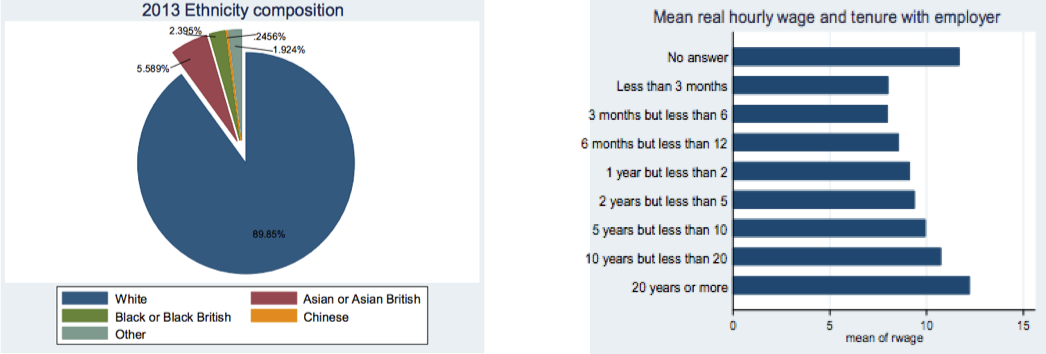
We graph the mean hourly earnings by occupation in Figure 4, with managers and professionals earning the highest wages (means of £13.99 (s.d. 6.97) and £14.94 (s.d. 6.04) respectively). Figure 5 shows that increased tenure with employer is associated with higher wages. Finally, Appendices 6-8 demonstrate that although most of the sample is white, the composition of ethnicities has become more diverse over the three periods, with the white proportion of the sample falling from 95.76% in 1997 to 93.60% in 2005 and 89.85% in 2013. Figure 9 shows that aside from the ‘other’ category, Asian or Asian British individuals have the highest mean hourly wage at £10.20 (s.d. 6.48), compared with the mean wage for white individuals of £9.97 (s.d. 5.71).
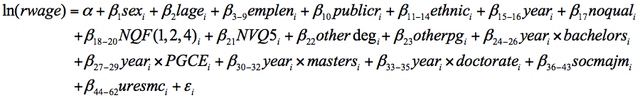
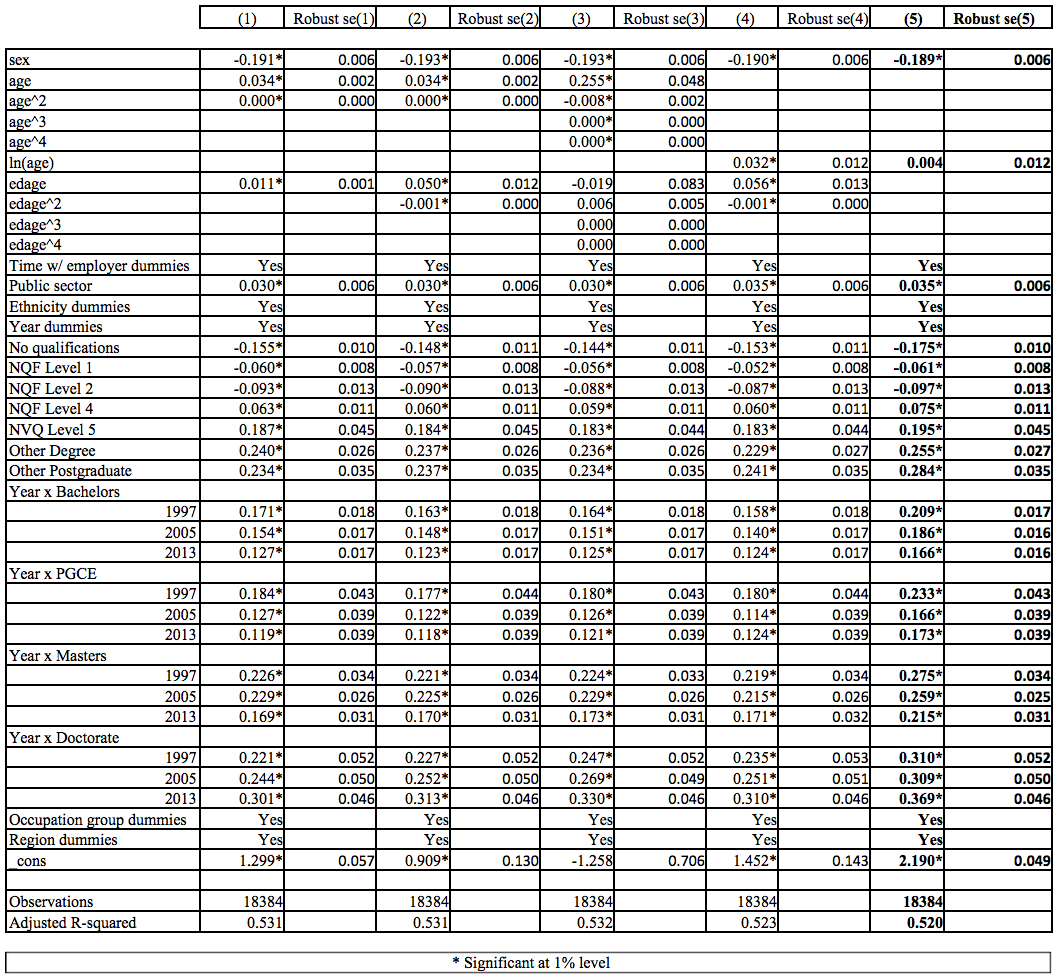
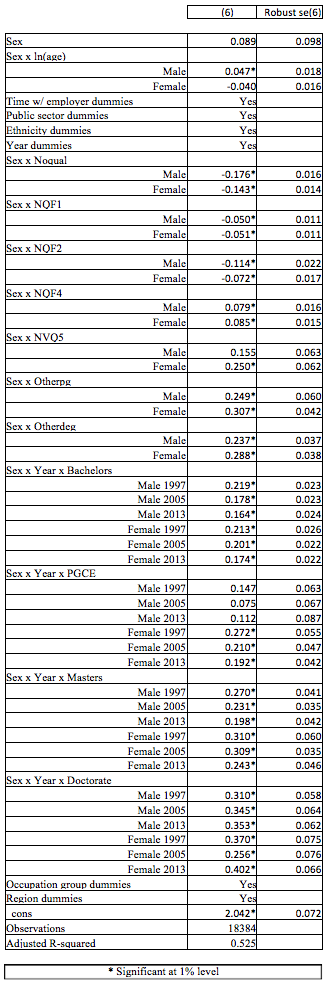
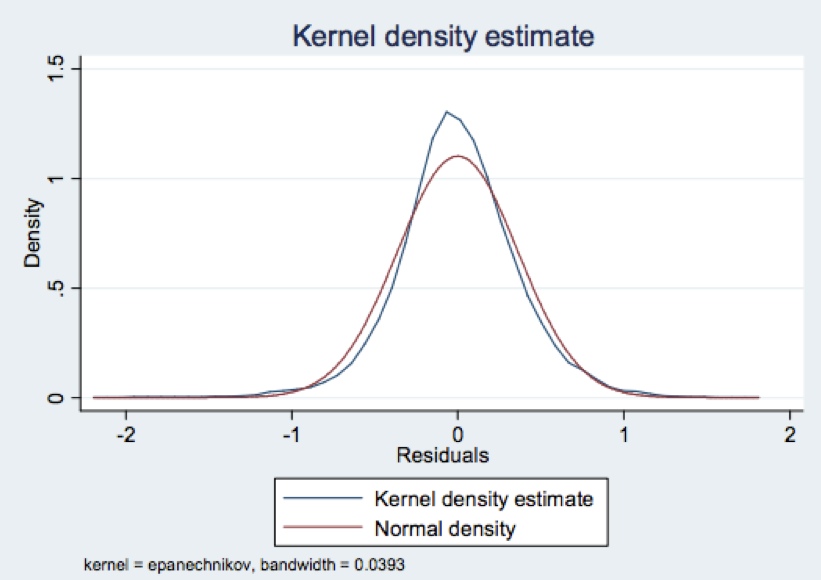
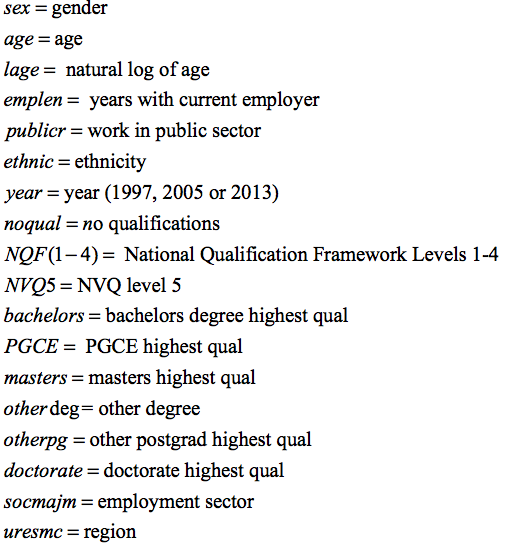
The ModelWe use OLS to model wage determinants, with particular emphasis on how returns to postgraduate qualifications have changed between 1997 and 2013. Using the standard form of the human capital earnings function (Mincer 1974) and Walker and Zhu’s estimation (2005) as a platform, our final base model is: We conditioned our analysis on individuals with positive tenure with their employers and with an age between 0 and 96 years when completed education, restricting our sample to 18,384 observations. The above functional form was selected after trialling different specifications with quadratic, cubic, quartic and log-forms of age and edage and plotting the residuals of each specification. We have a good degree of confidence in the robustness of our results: (i) the plotted residuals of the model appear normally distributed (as we should expect with a large sample by the Central Limit Theorem); (ii) the model has a high R 2 value of .520; (iii) the model passes a RESET test with a p-value of 33.36% and (iv) we found a similar pattern on year postgraduate coefficients for each specification we tried. Exclusion of edage and edagesq is reasonable as we already capture the effects of education with our qualification variables and improves the performance of our model in a RESET test. We use robust standard errors as we find evidence of heteroscedasticity when plotting the residuals versus the predicted values and this is further verified by a Breusch-Pagan test; we reject the null of constant variance with a Chi-squared value of 306.38. Part of the explanation for heteroscedasticity is that many individuals report their wages to the nearest £5,000. Our results are reported in Appedix 10, with our preferred specification in column five. Since our summary statistics suggest a structural break across gender, we perform a Chow test for structural change, yielding an F-statistic of 4.36: so we reject a null hypothesis of no structural change at the 1% level (critical value 1.32) and opt for a more flexible model, allowing for structural change across all of our explanatory variables. Although a RESET test now indicates possible misspecification, we remain confident in the robustness of our results because the inflexible model appeared correctly specified, the residuals for this flexible version (Appendix 12) appear normally distributed and the model has an R 2 value of 0.525. While misspecification is in general a concern in applied econometrics, as Clarke (2005) states we are possibly never going to work with a perfectly specified model anyway: our models are simply first-best approximations. The final results relevant for our purposes are reported in Appendix 11. There is, however, some cause to be concerned about endogeneity bias: in particular, that the coefficients on higher education levels are positively biased as a result of underlying unobserved ability. A highly driven and intelligent individual may undertake a doctorate as a result of these unobserved characteristics, but also earn more for those reasons in addition to the additional wages that a doctorate may facilitate. Blackburn and Neumark (1995, p. 228) suggest that ability bias may be as high as 40%. Moreover, our estimates might suffer from discount-rate bias: individuals with a higher discount rate may choose less education (Harmon and Walker 1995, p. 1278). Therefore ideally one wants a variable to proxy ability (Griliches and William M. Mason, 1972). Unfortunately the LFS does not record ability as a proxy for these unobservables (Blackburn and Neumark 1995, p. 221; Harmon and Walker 1995, p. 1278), so we must be aware of these as possible sources of bias such that the true coefficients may be lower.Continued on Next Page » 
From the Inquiries Journal Blog   Related ReadingMonthly Newsletter SignupThe newsletter highlights recent selections from the journal and useful tips from our blog. Suggested Reading from Inquiries Journal
Inquiries Journal provides undergraduate and graduate students around the world a platform for the wide dissemination of academic work over a range of core disciplines. Representing the work of students from hundreds of institutions around the globe, Inquiries Journal's large database of academic articles is completely free. Learn more | Blog | Submit Follow IJ
Latest in Economics |


