The High Cost of Living in Saudi Arabia: Growth and Inflation in a Macroeconomic Perspective
By
2014, Vol. 6 No. 09 | pg. 1/2 | »
IN THIS ARTICLE
KEYWORDS
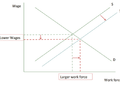
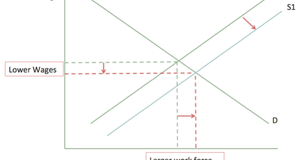
The Saudi economy is one of the most robust economies in the world. As “one of the best performing G-20 economies in recent years” (IMF), Saudi Arabia’s growth in real Gross Domestic Product (GDP) came in third after China and India's economies with an average annual growth rate of 6.25% from 2008 to 2012 (IMF, 2013). Meanwhile, public debt declined from 37.3% of GDP in 2005 to 2.7% of GDP in 2013—a remarkable achievement. However, inflation has remained relatively high, at an average of 4.17% in the period from 2007 to 2013. The problem of inflation is worse when we look into the main divisions of living costs; for example, in the Food and Non-alcoholic Beverages division the average inflation across the same period was 6% while for Housing, Water, Electricity, Gas and Other Fuels the average annual inflation rate was 7.9%. In 2011 alone in the same category, inflation was 11.4% (SAMA, 2014). 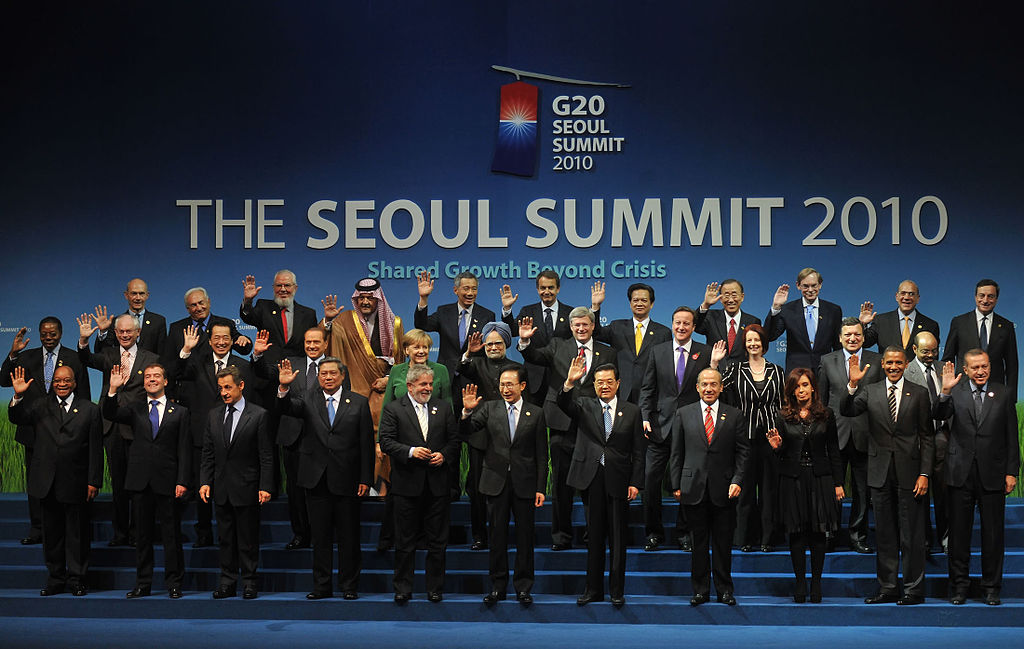 2010 G-20 Summit in Seol, South Korea. These increases in the cost of living have raised complaints from the Saudi population as nongovernmental agencies have claimed that the real inflation rate in the country is much higher than the official rate. For example, a survey by the leading Middle East job placement website claimed that cost of living expenses increased by 31% in 2013 and that wages were growing at a slower rate than the cost of living (Bayt.com, from Saudi Gazette, 2014). In this paper the causes of inflation in Saudi Arabia are discussed from a macroeconomic perspective by looking into different components of the economy. In the first section, the main components of GDP—Consumption, Government Spending, Investment and Net Exports— are described while looking at the trends and the relationships that have led to inflation. In the second section, we look more closely at the inflation figures, attempting to explain the discrepancies and determine the true causes of inflation in Saudi Arabia. Gross Domestic Product (GDP) in Saudi ArabiaSaudi Arabia’s GDP in 2013 was $745 billion, making it the 19th largest economy in the world(World Bank, 2014). When looking at the breakdown of GDP (see Table 1) we find that almost half is in the oil sector. Of the other half (non-oil), 70% is produced by the private sector and 30% is produced by the government sector(SAMA, 2014). And since the oil sector is owned and operated by the government, the result is that 65% of Saudi Arabia’s GDP is produced by government or government-owned institutions. Table 1: Breakdown of GDP YR2013
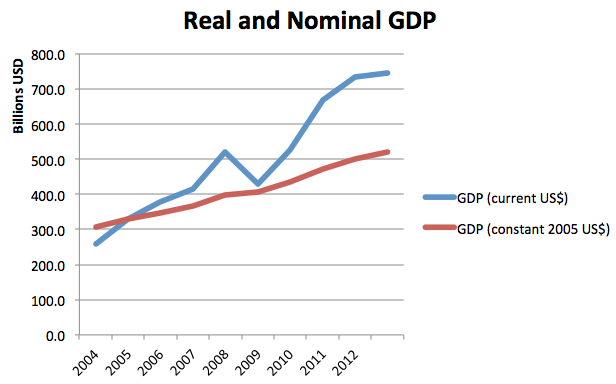
Over the past decade Saudi Arabia witnessed high growth rates. In nominal terms, its growth from 2004 to 2013 was 13.4%, but in real terms the growth rate was 6.3%. By definition the difference between nominal and real value is inflation, because the real value of GDP is holding the GDP to a base year, and nominal value is the GDP in current terms. This implies high inflation in the economy because of the big difference between the nominal and real figures for Saudi Arabia. Morovere, almost half of the current growth reflects inflationary factors. In Figure 1 we can see the difference between Real (constant 2005) and Nominal GDP from 2004 to 2013(World Bank, 2014). Figure 1
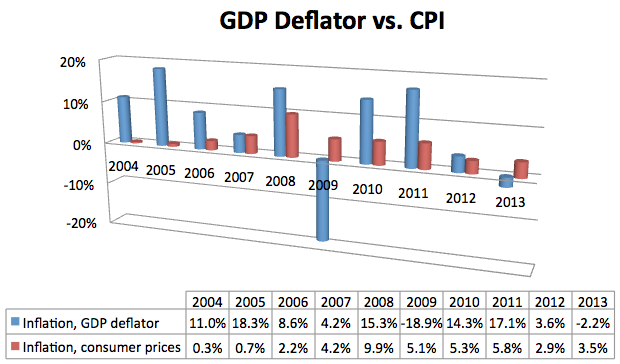
This can be shown more clearly by looking at the GDP Deflator figures in Figure 2 (World Bank, 2014). Figure 2
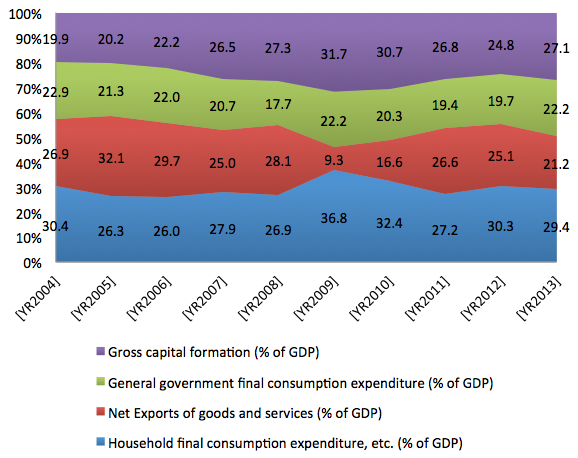
Why is there such a big difference between the GDP deflator figures and the Consumer Price Index (CPI) figures? First of all, they are not calculating inflation for the exact same thing. The CPI measures a basket of goods bought by consumers that are imported and produced domestically. The GDP deflator includes only domestic goods and is the price change of all goods and services in the economy calculated by the ratio of nominal to real GDP. In the long run, the GDP deflator and the CPI are supposed to be the same, but in Saudi Arabia this doesn’t seem to be the case. When taking the average inflation rate for both the CPI and GDP deflator data from 1969 to 2013, we find them to be 3.6% and 4.8%, respectively. This discrepancy could stem from the volume of imports; for example, in 2013 imports were 30.8% of GDP, and since, unlike the deflator, CPI incorporates price changes in imports, this could explain part of the inconsistency. Household ConsumptionUnlike the United States and many other economies that depend mostly on household consumption, Saudi Arabia’s household consumption makes up only about a third of the economy—in 2013 it was 29.4% of GDP. The graph in Figure 3 shows the shares of all the components of Saudi Arabia’s GDP. We find that in 2009 household consumption jumped to 36.8%. This is because exports in that year dropped dramatically because of the credit crisis. In 2012 household consumption grew 22%, the most it had grown in 10 years. This caused high demand for some goods, explaining some of the inflation, although inflation that year was 2.9%, almost half the figure of the year before. This shows that the relationship between household consumption and inflation is not strong, or at least the data is not consistent and doesn’t show a strong correlation. In principle, more consumption should lead to higher demand that could cause inflation. This relationship was evident before the credit crisis—higher growth in household consumption correlated with higher inflation, as shown in Table 2 (World Bank, 2014). Table 2: Household final consumption expenditure, etc. (current billion US$) & growth rate
Figure 3
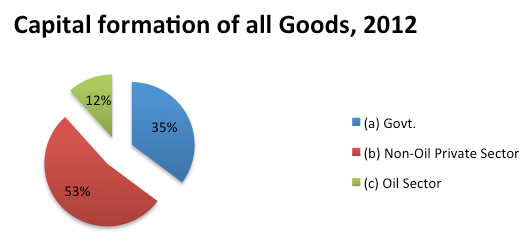
Government SpendingSince 2010, government spending has been growing into the double digits. In 2010 the increase was 12%; in 2011 growth was 22%; and in 2012 and 2013 growth was 11% and 14%, respectively. A big part of this increased spending came in the form of grants, for example, government housing grant funds and unemployment benefits like hafiz costs. Another large part of government spending went to infrastructure projects like the new industrial and economic cities, which are new cities built near major cities to attract local and foreign investment in the areas of manufacturing. For example, Tabouk, Hail, Madinah, Jazan and Rabigh all have nearby economic cities that promote economic growth. Consequently, government subsidies increased 47% and 45% in 2012 and 2013, respectively; this put more money in the pockets of consumers, pushing prices up. Also notable is the largest part of government spending, the defense and security toll, which made up 35% of government spending in 2013 (SAMA, 2014). InvestmentIn Figure 4, we see that the non-oil private sector was the biggest contributor of investments in 2012 (SAMA, 2014). Furthermore, within the different sectors of investment, residential building construction made up 16%, and non-residential made up 38%, for a total of 54% of total investment; this reflects the high demand in the real estate sector and could explain the high inflation in the real estate market, which was one of the most inflation-affected sectors. Moreover, real estate loans were up 25% annually on average from 2009 to 2013, and this added to the demand for real estate(SAMA, 2014). This high demand for real estate in Saudi Arabia for the past seven years was a result of many factors, the most important being changes in demographic factors: there are a larger number of people in the marriage stage of life who are looking for homes to start their new lives. (More details on this topic are given in later sections.) Additionally, after the Saudi stock market crash in 2007, many investors shifted their investment preference to real estate, which they considered a much safer investment vehicle. This created access demand on the sector, causing property prices to appreciate. Subsequently, the lack of affordable housing resulted in a sharp rise in rents in the period from 2007 to 2011, becoming a main source of inflation, as we will see in the CPI section of the paper(IMF, 2013). Figure 4 (SAMA, 2014)
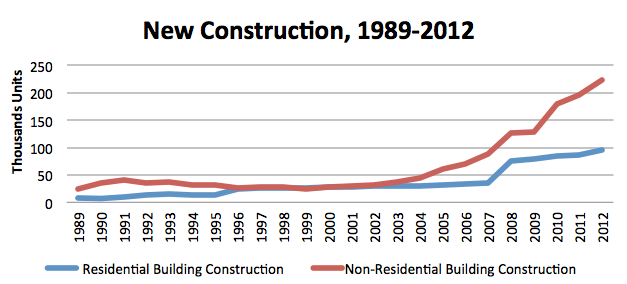
We can see from Figure 5 a rise in new construction units in the past decade, especially in the non-residential sector. This sharp increase in supply is a response to the high demand that was causing high inflation in the real estate sector, as we have stated above (SAMA, 2014). Figure 5
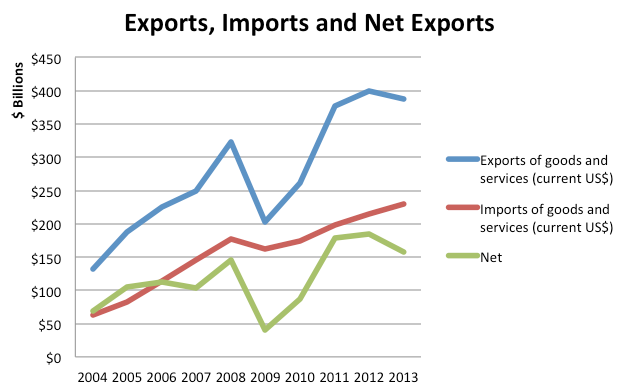
Net ExportsSaudi Arabia’s exports are always greater than its imports; this is due to oil exports, which are the biggest part of the nation’s economy. Therefore, as shown in Figure 8, Saudi Arabia always has a trade surplus (SAMA, 2014). Figure 6
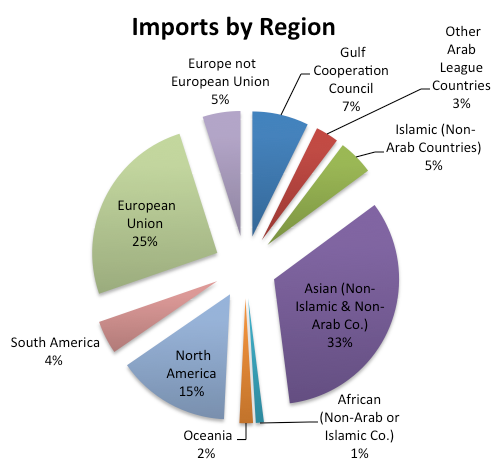
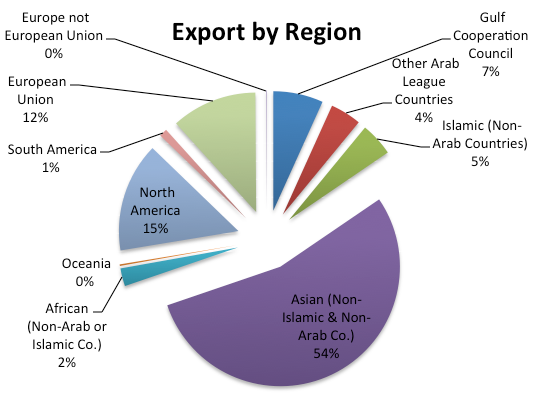
Looking at the import chart in Figure 6, we notice that Saudi Arabia’s imports are mostly from Asia (33% are from China, Japan, India, South Korea … in that order) and then from the European Union (25%) and then from North America (15%). This means that Saudi Arabia’s cost of living is affected by all of these regions. If the US dollar depreciates, Saudi Arabia’s buying power becomes weaker (the Saudi riyal is pegged to the US dollar) and many things go up in price. We will talk more about this in the currency section of this paper(SAMA, 2014). In the same way, exports are also diversified (see Figure 7), but here they are more dependent on Asia, with 54% of exports going to Asia. In Saudi Arabian income, the driving force for demand is affected by growth in Asia and the world demand for oil (SAMA, 2014). Figure 7
Figure 8
Saudi Arabia’s two largest import categories are Machinery, Mechanical Appliances, Electrical Equipment & Parts Thereof, and Transport Equipment, with figures of 26% and 17%, respectively. The fastest growing import groups are Mineral Products (29.9%), Arms, Ammunition & Parts Thereof (29.0%), and Pearls, Precious & Semi-Precious Stones, Precious Metals, Articles & Imitation Jewelry (22.4%). See Appendix 1 for the full list(SAMA, 2014).Continued on Next Page » 
From the Inquiries Journal Blog   Related ReadingMonthly Newsletter SignupThe newsletter highlights recent selections from the journal and useful tips from our blog. Suggested Reading from Inquiries Journal
Inquiries Journal provides undergraduate and graduate students around the world a platform for the wide dissemination of academic work over a range of core disciplines. Representing the work of students from hundreds of institutions around the globe, Inquiries Journal's large database of academic articles is completely free. Learn more | Blog | Submit Follow IJ
Latest in Economics | ||||||||||||||||||||||||||||||||||||