Democratic Misrepresentation: A Quantitative Analysis of Out of District State Campaign Fundraising
By
2021, Vol. 13 No. 01 | pg. 1/1
IN THIS ARTICLE
KEYWORDS
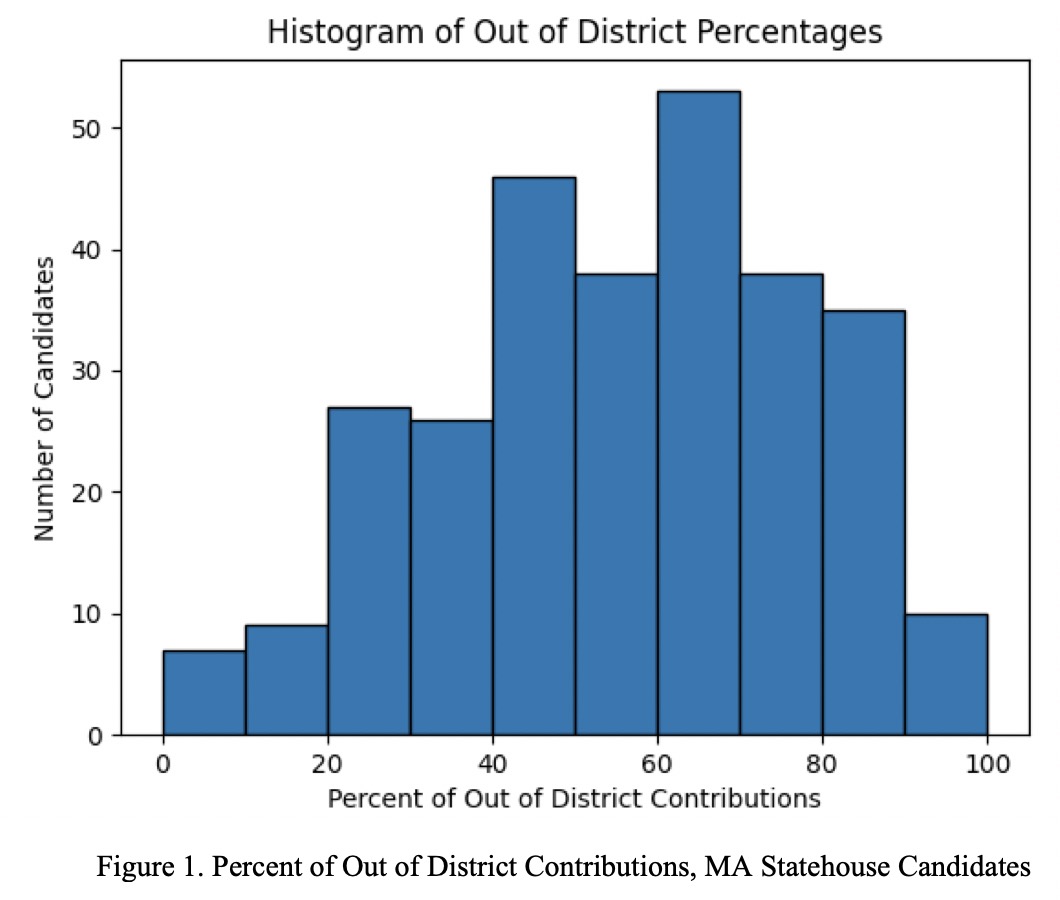
AbstractThis paper aims to fill the gap in quantitative research on out of district donations at state levels of American government. Examining inequality in donor representation is an important part of ensuring an equitable and just democracy. Using donor data from the Massachusetts Office of Campaign and Political Finance (OCPF) we identify unjust patterns in out of district contributions to state representatives in the 2016-2018 Massachusetts campaign cycle. Specifically, we examine economic, occupational, and racial factors through the use of home price estimates as a proxy for wealth, self-reported occupation data, and Bayesian Improved Surname Geocoding (BISG). Our economic findings prove that out of district donors tend to be wealthier than in district donors demonstrated by a 5% to 24% higher mean home value for out of district donors. Our occupational findings indicate that the voices of constituents who are most impacted by the policies in their home district (educators, retirees) are diluted by the social capital of individuals outside of their district (executives, lawyers). Our racial findings conclude that the difference between the average out of district and in district contribution for white donors is significantly higher than minority donors at +42% and +19% respectively. We also find some evidence of racial homophily in out of district contributions that could benefit historically underrepresented candidates. However, our results indicate that the majority out of district donations give disproportionate influence to a socioeconomically privileged subset of citizens, undermining our representative democracy. IntroductionIn 2014, Alabama resident Andrew McCutcheon challenged the Federal Election Commission’s regulations limiting the aggregate campaign contributions an individual may donate during an election cycle to all federal candidates nationwide. In a 5-4 ruling, the Supreme Court sided with the plaintiff and struck down individual aggregate limits allowing McCutcheon to contribute to many candidates in states and districts outside of his own. Chief Justice John Roberts began the majority opinion by writing, “There is no right more basic in our democracy than the right to participate in electing our political leaders” (McCutecheon, 2014). However, the late Justice John Paul Stevens pointed out an inherent contradiction in the majority opinion: "The very first sentence of the Chief Justice's opinion lays out a basic error in this whole jurisprudence. He says that there is 'no right more basic in our democracy' than to pick our elected officials. But the case is not about whether individuals can pick their own congressmen. It's about giving lots of campaign contributions, picking other people's congressmen, not your own" (Stevens, 2014). McCutcheon v. Federal Election Commission (2014) sparked a debate in academic literature surrounding the efficacy and morality of out of district and out of state campaign contributions. Some scholars suggest that “regardless of the state within which they live, each congressperson has a direct relationship with each American” (Pettys, 2017). In a paper published in the Harvard Law Review, Jessica Bulman-Pozen takes a more nuanced stance in her argument that out of district donations are a by-product of ‘Partisan Federalism’: a method through which citizens can express their partisanship to check the federal government and support state policies and candidates. Bulman-Pozen contends that “the very fact that individuals from Texas seek to influence California politics, and vice versa, indicates that the states are critical actors on the national stage. Cross-state political participation demonstrates states’ importance as sites of governance and identification, not their lack thereof” (Bulman-Pozen, 2013).Another Supreme Court case that preceded the McCutcheon decision, also adds credibility to the argument against out of district contributions. In Bluman v. FEC (2011), the court reaffirmed that foreign nationals residing in the United States are prohibited from making any local, state, or federal campaign contributions. In Citizens United v. FEC (2010) the Supreme Court ruled that political contributions are speech and therefore subject to little regulation. However, Bluman highlights that the person doing the speaking and their relationship to the campaign must also be considered. Therefore, the Bluman v. FEC ruling may open the door for states to ban contributions from non-residents. An amicus curiae filed in a case similar to Bluman, called, VanNatta v. Keisling (1995), claimed that “from Oregon's constitutional perspective, a citizen of Florida, Texas or Vermont has no more of an interest or stake in voting or making campaign contributions in Oregon than does a citizen of Montreal or Mexico City. Again, viewed through the proper lens of American federalism, all persons who are not legal residents in Oregon are non-citizens and have no state-based political rights in state elections” (National Voting Rights Institute, 1998). While the debate over the democratic ramifications of out of district contributions continues to persist in academic literature and federal courts, there is limited quantitative analysis of the inequities that are magnified by a political system that is reliant on out of district contributions. In a study of contributions to a South Dakota referendum on abortion, the authors posture that “sparsely populated states such as South Dakota are particularly vulnerable to influxes of out of state campaign money” and could “jeopardize [the state’s] electoral autonomy” (Garry, Nelsen, Spurlin 1). Scholars suggest that out of district political contributions have the ability to undermine the decision-making power of the residents of an area, especially less-populated and poorer districts. Not only does this system affect constituents, but it also affects their politicians themselves: “representatives with influence over legislation receive the highest proportion of out of-district and out of-state money, even when the analysis controls for party membership” (Grenzke 1). In 2018, approximately 73% of total money given to U.S. House Candidates came from outside of their district (McCammond & Stevens, 2018).1 As scholars mull the implications of the growing trend of out of district contributions, many have largely ignored the effects of out of district donations on state and local races. This paper seeks to fill the gap in academic literature on the out of district phenomenon in state races by focusing on a case study of Massachusetts. The paper makes key insights relating to the economic, occupational, and racial disparities in representation and contributions that are magnified by out of district political contributions. Defining Out of District ContributionsFor the purposes of this paper, we define an out of district donation as a contribution that is given by an individual who lives outside of the candidate’s home district. In essence, we focus on contributions to representatives that are not on the donor’s ballot. When calculating out of district proportions, we divided the total number of out of district contributions by the total number of individual contributions. The population we considered only includes individual donations which are less than $1,000 as mandated by Massachusetts state law. We did not include any contributions from groups or political action committees. The method through which we were able to determine the geographical location of each contribution and classify each one as in or out of district is outlined in Methodology: District Location. Prevalence of Out of District Contributions in MassachusettsWhile current literature focuses on the prevalence of out of district money in federal elections, this paper highlights the magnitude and impact of out of district contributions at the state level. Figure 1 shows a histogram of the percent of total individual contributions received outside of their district during the 2016-2018 election cycle for all of the candidates in the Massachusetts Statehouse Races.
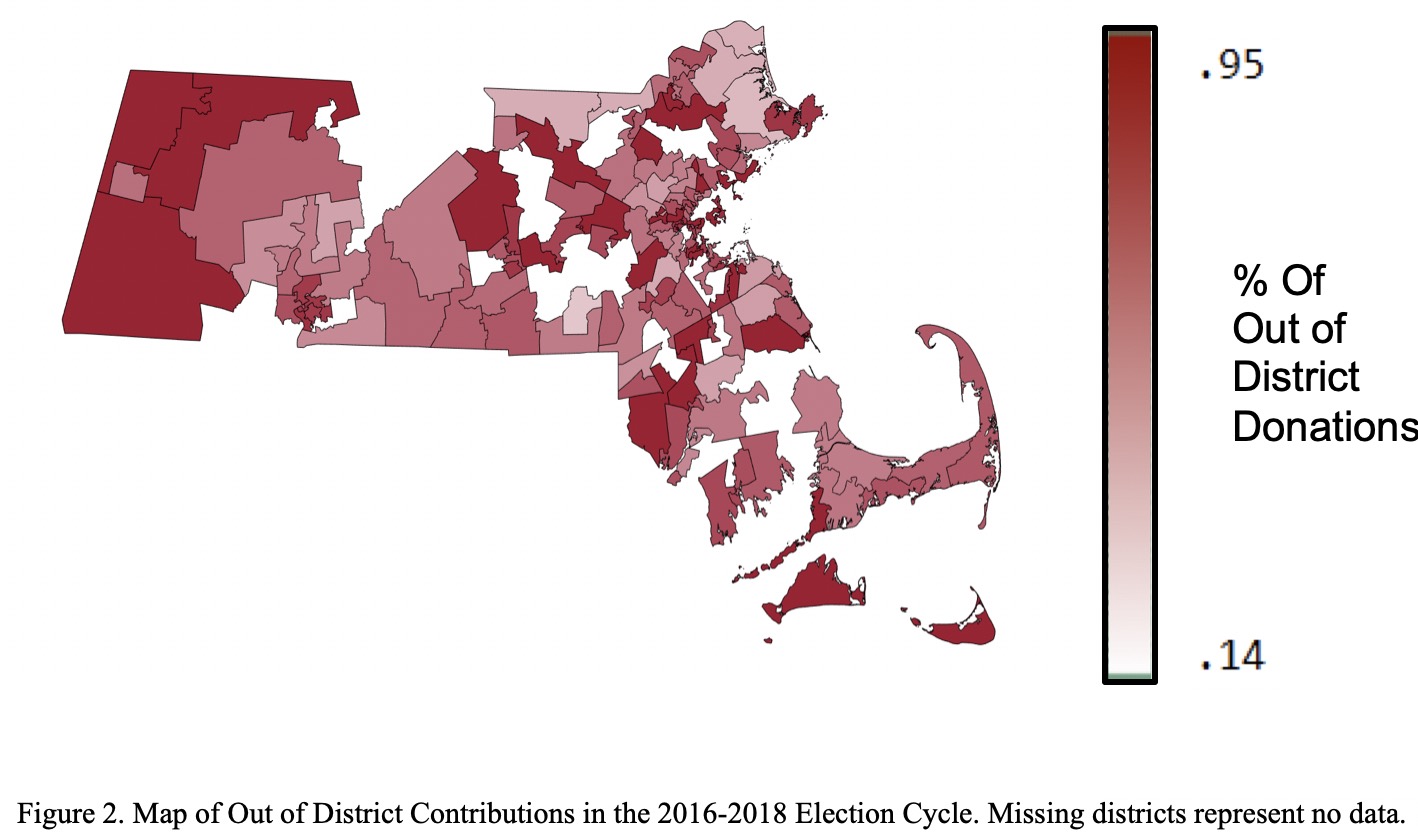
As depicted in Figure 1, there is a high variation in the receiving patterns of the 290 candidates included in the study: 178 of whom receive over 50% of their individual donations from outside of their district. Figure 2 shows this data as a geographical representation.
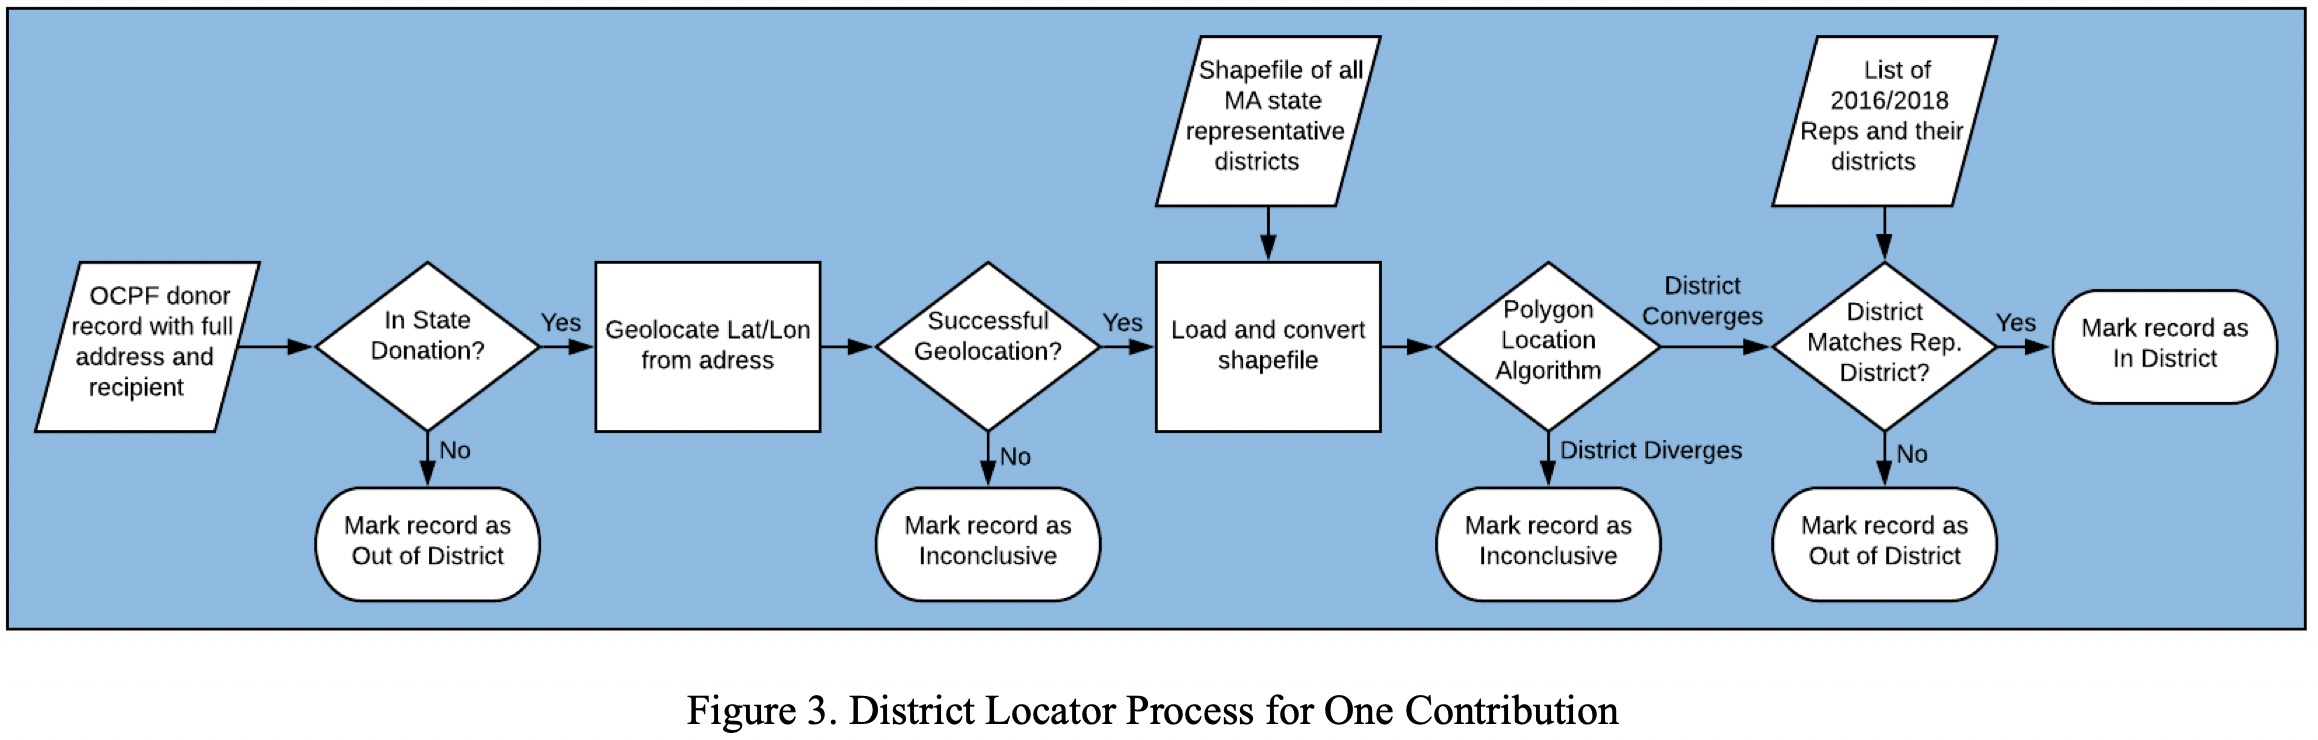
Research GoalsOur paper has two central goals. The first is to explain this variation in out of district proportions by economic, occupational, and racial factors. How does wealth quantitatively impact how often and how much people donate to other districts? Why do the social implications of one’s occupation corrupt their political interests? And lastly, how is race-related to a citizen’s district-based voting behavior? In addition to answering these questions, our paper aims to outline the impact out of district donations have on political representation and democracy. MethodologyThe majority of our data was sourced from the Massachusetts political donation registry. In conjunction with the Massachusetts Office of Campaign and Political Finance (OCPF)2, we received a comprehensive dataset3 of all 508,777 donations from the 2016-2018 Massachusetts state-level election cycle. This data includes all recorded contributions to candidates running for the 40 state senator positions and the 160 state representative positions.4 As our research focuses solely on the donations of individuals, all corporate, union, and PAC donations were filtered out of the dataset.5 Also, we are working only with contributions for state representative positions to identify the localized disparities found between in and out of district contributions. As a result, the dataset is narrowed down to 74,188 donations split among 290 state legislative candidates. Identifying Donor DistrictsThe first step in identifying disparity between in and out of district donation demographics was to accurately determine the district status of each recorded donation6. To identify the donor’s district from the OCPF donation records, we use a Python Script7 that geolocates a donor’s coordinates from their address8. Those coordinates are then superimposed over a shapefile map9 of Massachusetts state representative districts. From the shapefile, a Polygon Location algorithm10 is implemented to determine which district the donor resides in.11
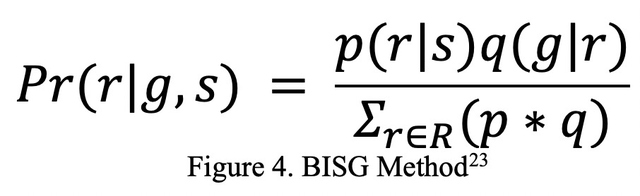
Finally, the script checks if the donation recipient is a representative of that district. After regularizing addresses to account for common mistakes and typos, this location process yields an 81% overall success rate. This method has two common failure modes: 14% of donors cannot be geolocated because of mistyped or unregistered addresses and another 5% are inconclusive in district due to inaccuracies and overlaps in the shapefile. These failures represent the trade-off encountered when attempting to identify donor districts on such a localized scale and help explain the limited research on this topic below the federal level. EconomicWith the general in district vs. out of district data, we can conduct more thorough analyses to identify disparities between the two strata. The first demographic that we explore is economic; we aim to see whether the wealth of an individual explains their out of district contribution patterns. We explore economic disparity in two ways: through simple comparisons of out of district contributions and through the predicted wealth of individual donors. For the donation-based analysis, we compare the distributions of contribution amounts and frequency to draw conclusions about the overall contribution trends for in district and out of district donors. To examine the wealth of individual donors, we use Zillow’s Home Price Estimate API (‘Zestimate’) as a proxy for a contributor’s net worth. Across the nation, Zillow’s 97.5 million home estimates are within 10% of the actual home price 95% of the time.12 Because of this consistency, the Zestimates can be used to indicate a wealth disparity between out of district donors and in district donors. Out of the 74,188 donors, we extract 1,000 randomly selected homes across all districts. Accounting for inconclusive Zestimate results, the extraction successfully yields a representative sample of 771 home prices with each record defined as in district or out of district. We take the natural log of the home data to normalize the price distribution and satisfy the nearly normal condition for statistical inference. A two-sample T-Test is used to infer the relationship between the mean out of district and in district home prices. Note that there are some limitations to the home price proxy method. The method ignores the value of rental properties, which may be more common in cities and lower-income districts. Also, home prices are not directly indicative of a homeowner’s wealth; financial factors like varying housing markets and secondary properties may distort the true wealth of that donor. However, because the random test includes all 160 districts, a high ratio of rental units in one district will equally affect the missing data for in district and out of district donations. The representativeness of home prices benefits from this randomness in a similar manner: while some donors' wealth may be much different than their home price, this variance is not dependent on whether the homeowner is an in district or out of district donor. So, neither of these issues introduce systemic bias into the current experiment. OccupationAnother demographic of interest is donor occupation. While it may seem economic in nature, we explore donor occupation largely because of the social implications of one’s job. For example, professionals with a vested interest in their community such as teachers may donate more to their own representatives than lawyers and executives. Since occupation is self-reported by the donor, we are limited to the 60.2% of donors who provide their occupation. The first limitation we encountered is that we cannot conduct analyses on the overall occupation distribution due to response bias. However, we can assume that one’s decision to report their occupation is independent of their decision to contribute outside or inside their district. Therefore, the response bias will not affect our findings as long as we do not calculate inter-group metrics. Given this constraint, we only analyze the percent of out of district contributions and average contribution within each occupation group. A second limitation that we encounter is the wide range of titles that donors use to describe similar jobs. For example, the word “lawyer” and “attorney” are interchangeable but appear as two separate occupations in the dataset. To overcome synonymous job titles, we manually categorize the 200 most frequently reported occupations into fifteen groups with distinctive social and professional factors. These groups13 account for more than ⅔ of the listed occupations by including common fields such as Education but also demographic-based groups such as Students and Retirees. One potential point of concern is that the grouping is done using our own personal knowledge of job industries so it is subjected to our own personal biases. To mitigate the subjectivity of this potential flaw we decided to exclude certain self-reported occupations that we considered too ‘vague.’ One such example was the occupation, ‘principal,’ which could be interpreted as either an officer of a corporation or a school administrator, which are two socially and economically different jobs. In addition to these ‘vague’ occupations, there were a number of listed occupations that for our purposes are considered invalid, including donors who claimed their job to be ‘n/a.’ Using the method described in Section 3.1, we were able to identify each contribution within each job group as either an out of district or in district contribution. We established a binary label for each contribution with “1” referring to out of district contributions and “0” for in district contributions. To test if the variation in out of district donor behavior by job group was significant, we conducted a one-way ANOVA test. Given the large sample size and independence of the data, we were able to satisfy the necessary conditions for this test. RaceHistorically, racism has played a significant role in suppressing the political voices of minority races in the City of Boston. Even today, we see the remnants of gerrymandering and segregation in historically black neighborhoods14. As such, we feel that race is a crucial demographic to understand the significance of Massachusetts out of district donor patterns. To identify these racial disparities in political donations we must identify the races of donors based on the data found in the OCPF registry. Since the dataset does not include donor race, we use the Bayesian Improved Surname Geocoding (BISG) method15 to generate a probability distribution of races for each donor based on their last name and location. These distributions are then used to calculate disparities between in district and out of district donations by race. While these probability distributions are not 100% accurate on their own, the central limit theorem states that they will converge to accurate representations of donor behavior when applied to tens of thousands of records. To utilize BISG, we use the Census Surname API16 and a dataset of racial distributions by town17 and by Boston city district.18 The census is used to extract the racial distribution of all Americans that share the donor’s last name. This extraction includes the four most prevalent races in MA: White, Hispanic, Black, and Asian. These distributions are then improved by applying Bayes Rule for conditional probability using the racial distributions of that user’s given town or city district19. Massachusetts donors with missing or invalid towns are improved using the racial distribution of the state of Massachusetts. Out of state racial distributions are generated using only surname analysis.
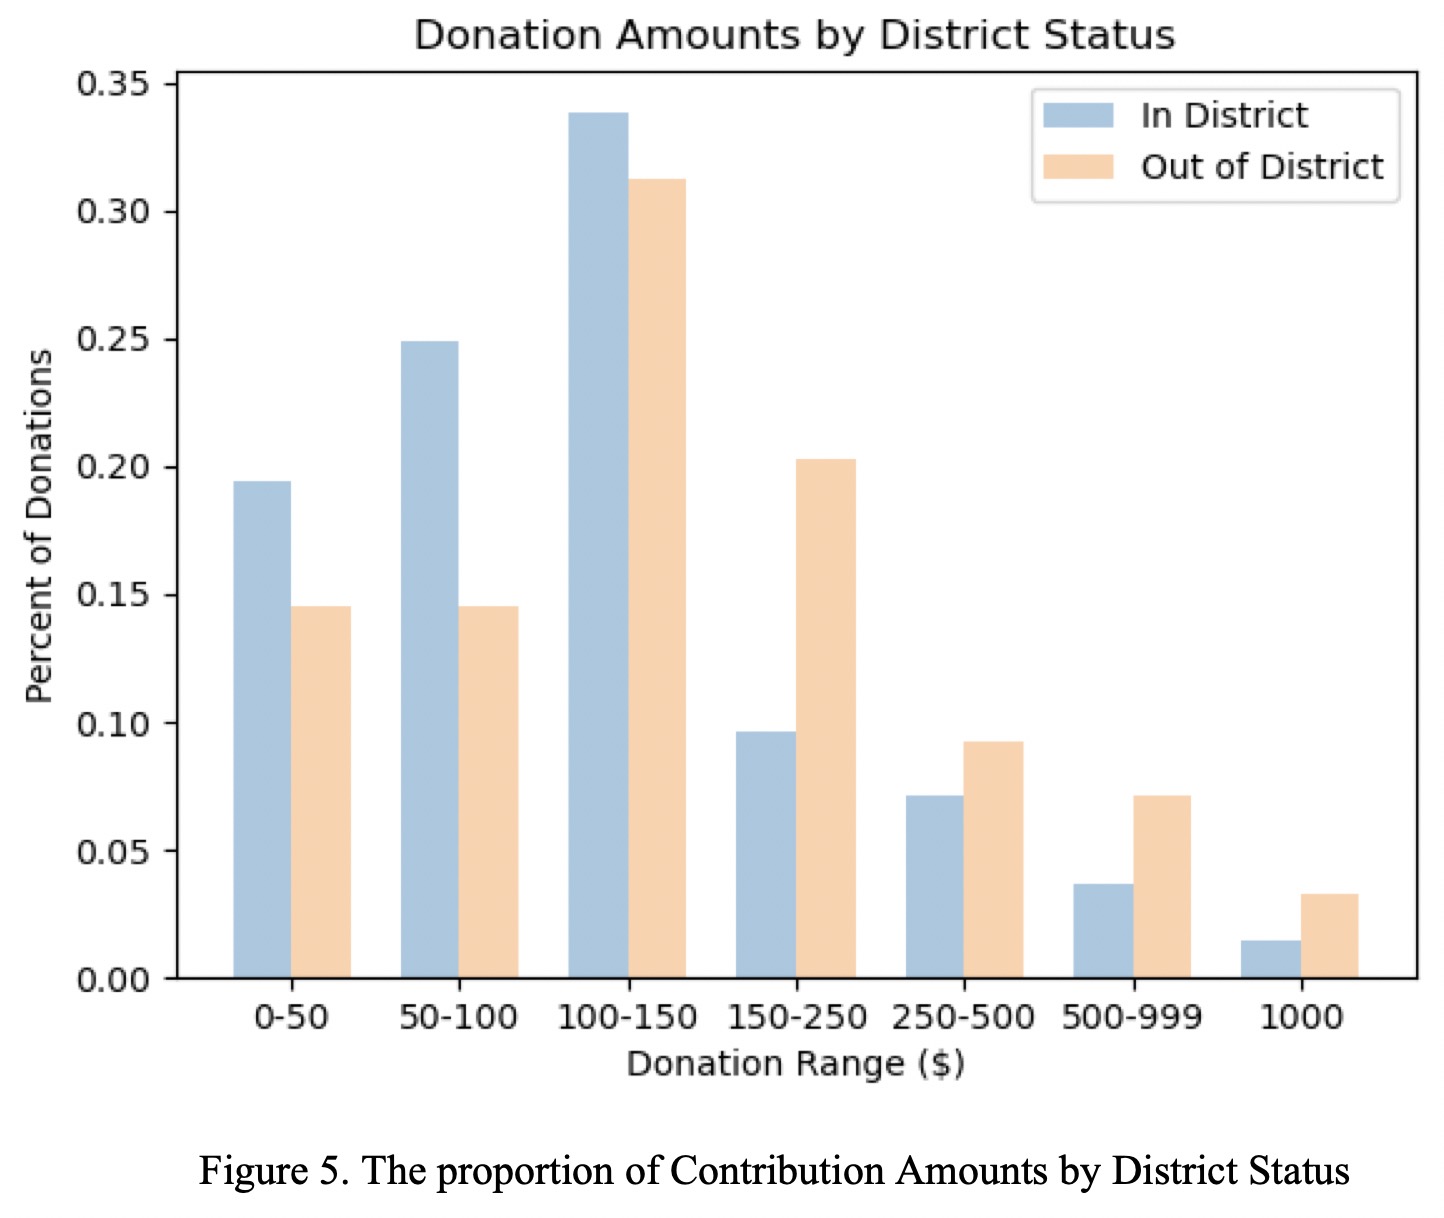
With these distributions, simple linear transformations are used to calculate summary statistics by race stratified by in district and out of district donations. We also use these to identify disparity by comparing and contrasting statistics such as the average out of district contribution amount by race. To focus specifically on the local implications of racial trends in out of district donations, we explore the racial composition of out of district donors to individual candidates. These tests allow us to study the role of homophily as a motivating factor for out of district donations. Note that there are limitations to the BISG approach to estimating race. To protect privacy, the census API censors the racial distributions of surnames with less than 100 records, which applies more to the unique names of minority races leading to an underrepresentation of these groups in our analyses. Because of this systemic bias, we cannot calculate dependent statistics such as the total number of donations donated by race. We can only conduct analyses on factors unaffected by the total number of donors, such as the average amount donated by race and the proportion of in district donors. FindingsEconomicOur most naive approach of identifying economic disparity between in district and out of district contribution revealed a surprisingly unjust relationship. A simple comparison of average contributions between the groups revealed that the 24,241 in district donors had an average contribution of $123.47 while the 35,820 out of district donors gave $175.04 per contribution, an increase of 41.8%. Out of district contributors were particularly generous in contributing Massachusetts’ maximum legal individual contribution amount of $1000. 3.3% of all out of district contributors donated this amount, in comparison to 1.5% of the in district donors. However, these maximized contributions do not explain all the disparity. Even if we ignore the $1000 donations out of district donors still contribute 34.0% more on average ($146.93 vs. $109.73). An in-depth comparison of average contribution amounts between in district and out of district donations is shown in Figure 5.
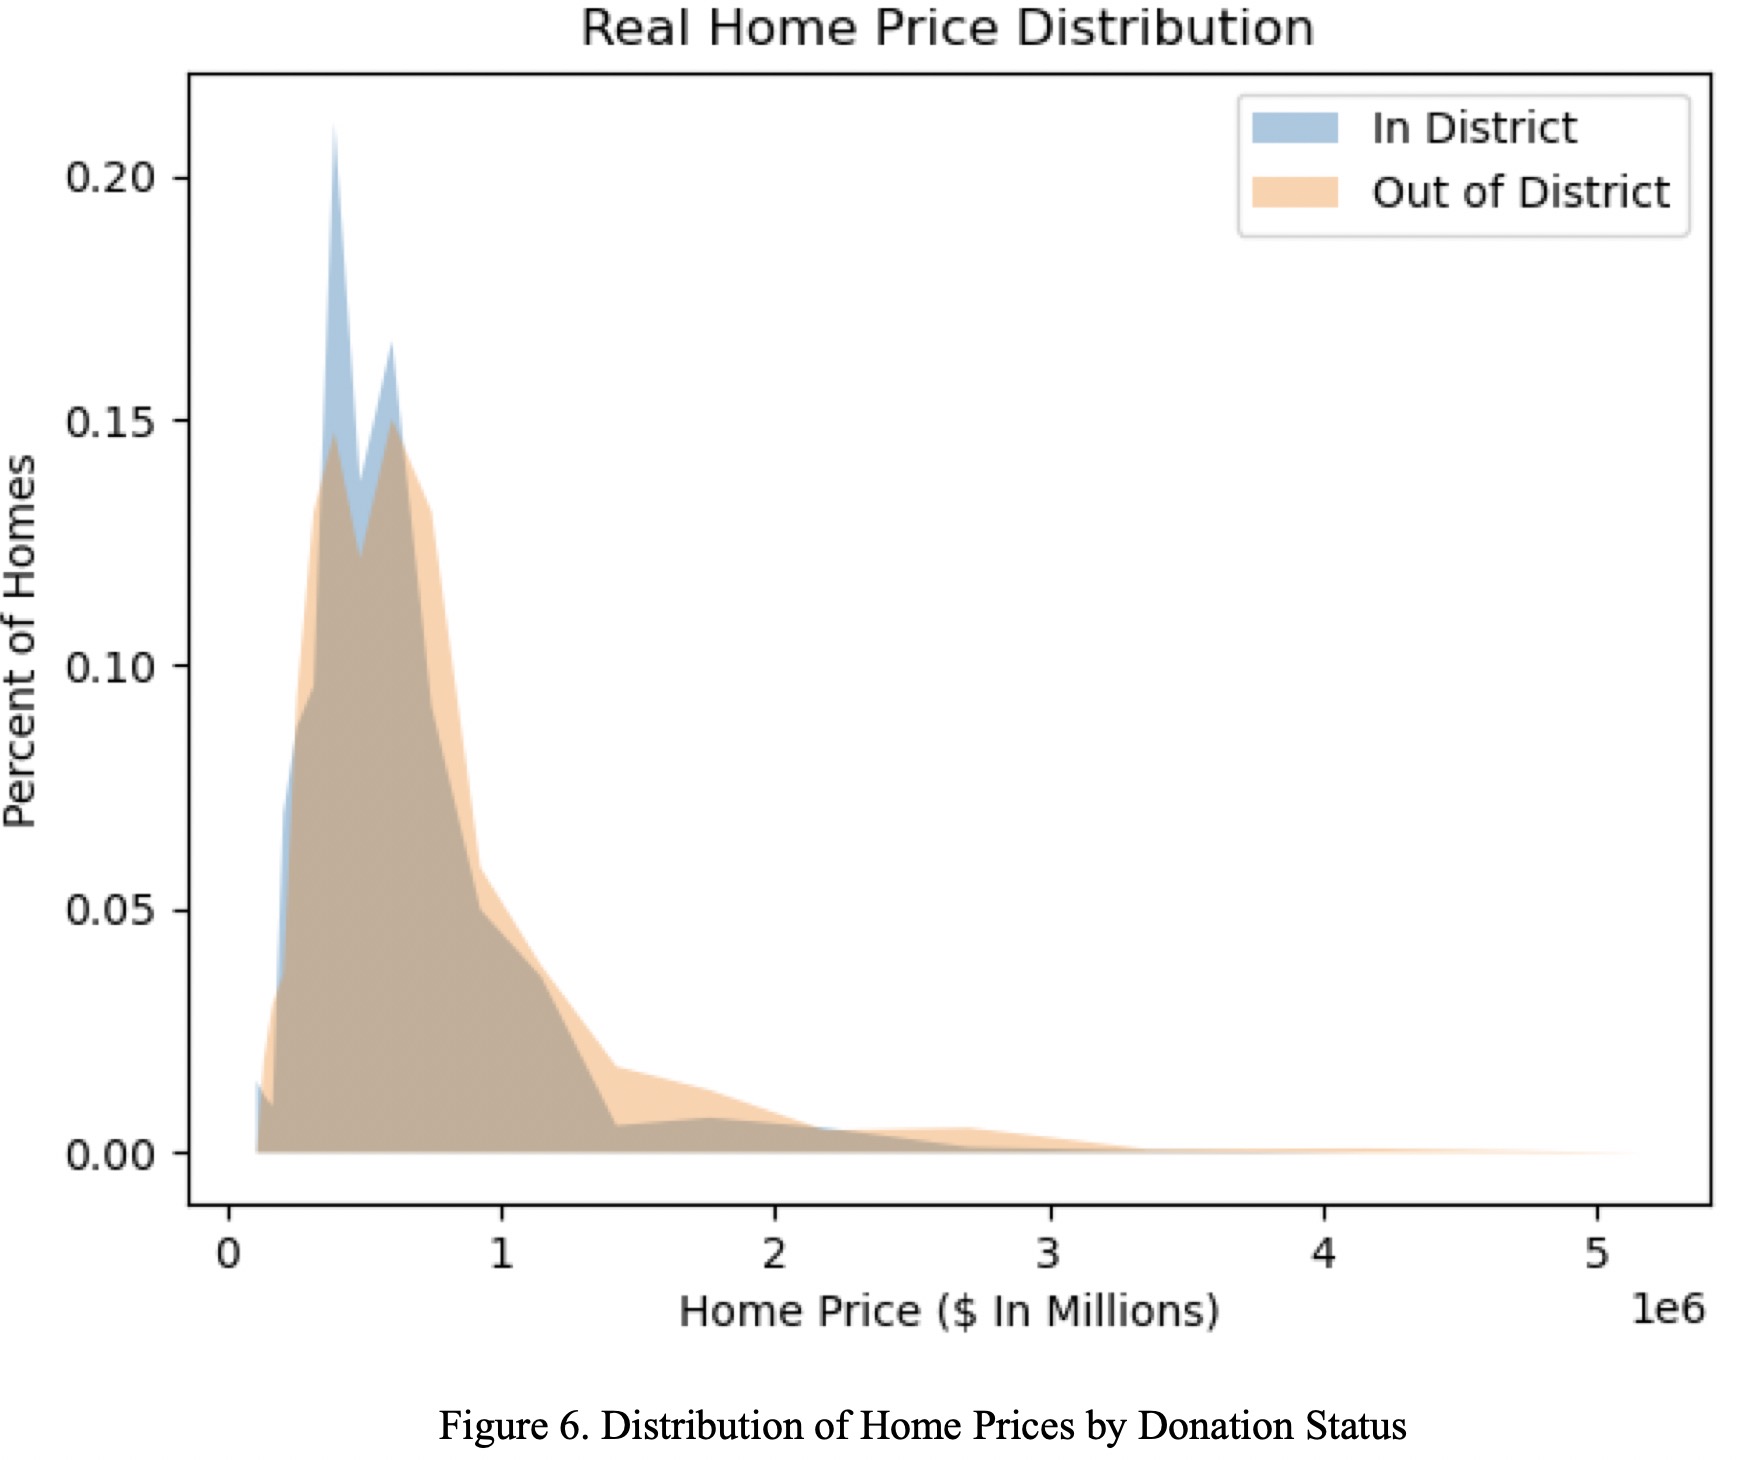
Figure 5 shows the distribution of average donation amounts from in district and out of district contributors. As seen in the graph, donations over $150 are disproportionately sourced from out of district contributors. This relationship highlights a worrying trend of out of district donor behavior: these contributors give large donations much more frequently than in district donors. Because of this trend, large contributions make the financial support of in district donors less crucial to a candidate’s success. The relationship reveals how the donor base of a candidate can be skewed by the contributions of out of district donors. Out of district contributions have the potential to distract a candidate’s focus away from their constituency and corrupt their legislative priorities. The second method of economic examination is through the home prices of donors. Using Zillow’s Zestimate API we create a proxy for overall wealth by collecting a representative sample of 771 home prices (323 in district and 448 out of district). The resulting distributions are represented in a probability density graph in Figure 6.
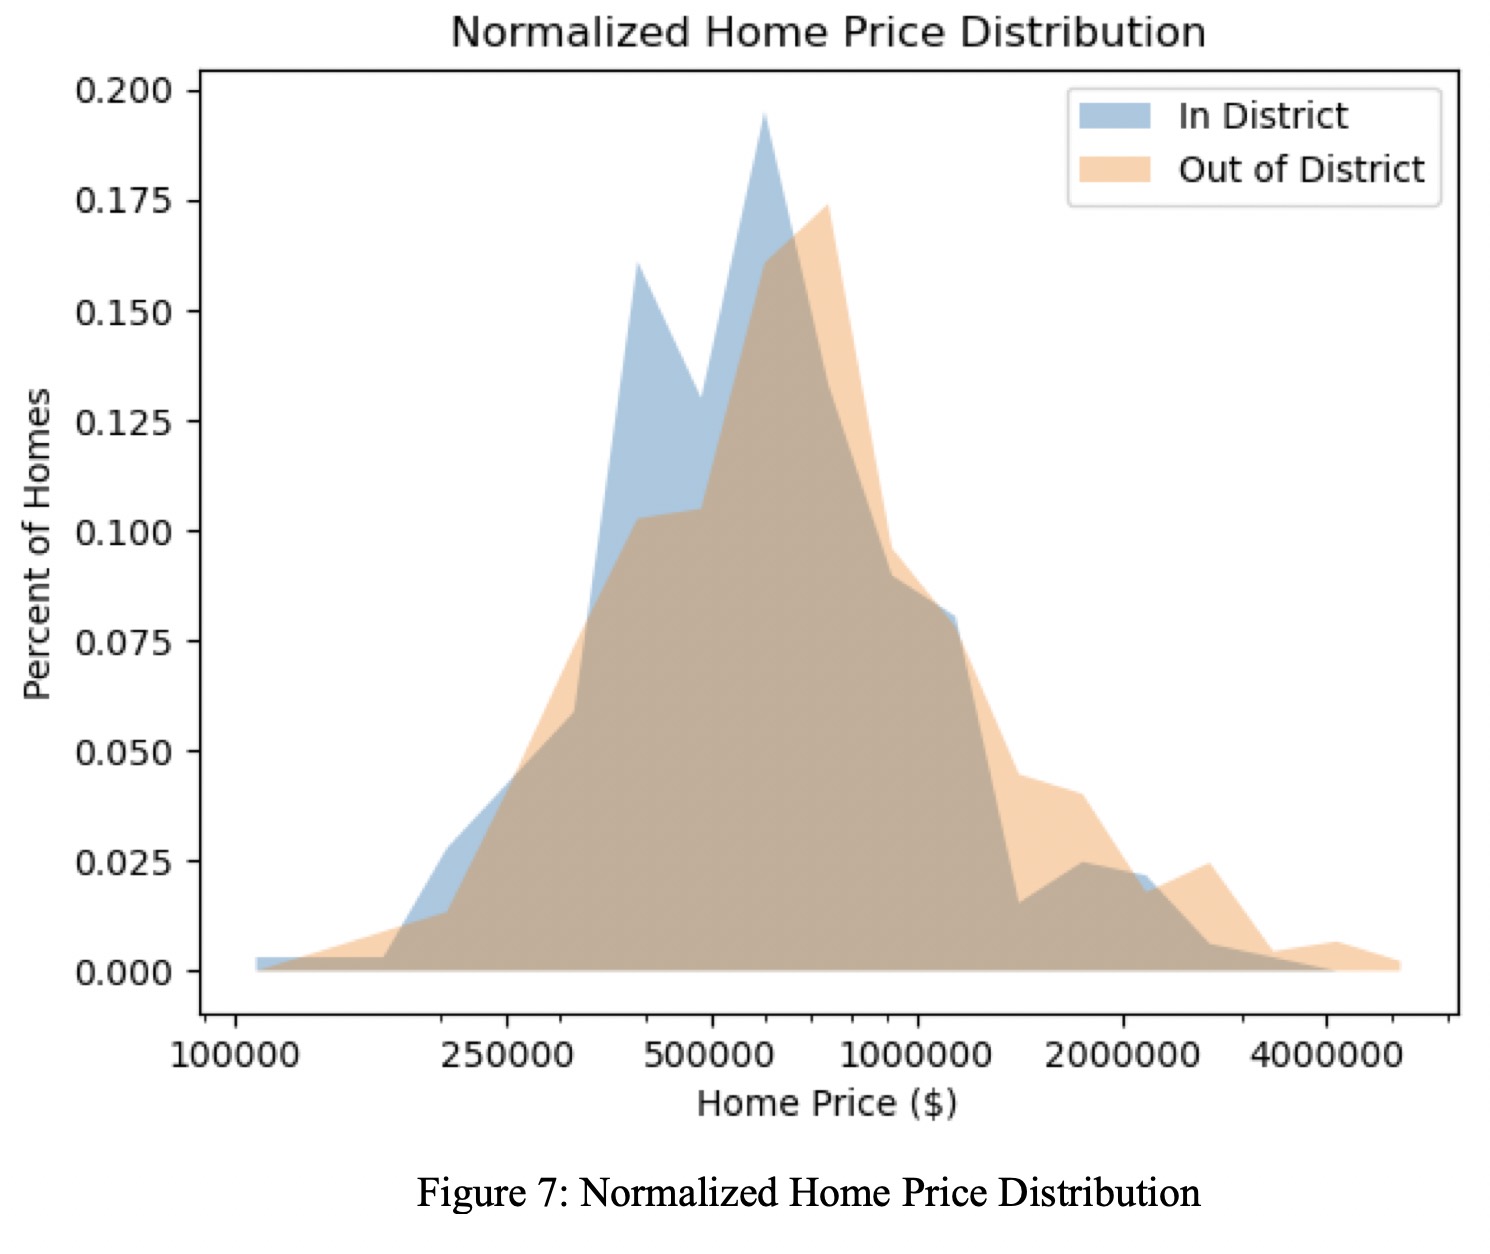
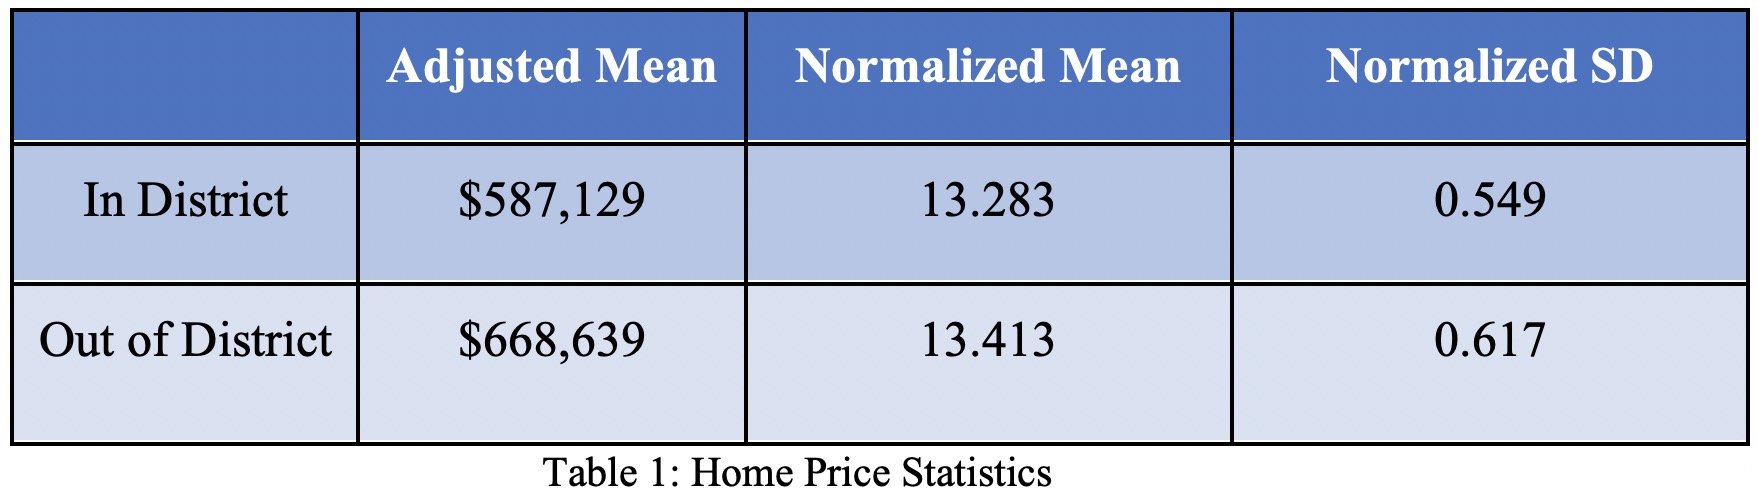
Unadjusted, the average home price of an in district donor was $688,426 in comparison with the average out of district donor: $823,708. However, the data is heavily skewed right; to put it in perspective, the median in district and out of district homes are $570,990 and $649,575, respectively. To run statistical inference on the data while accounting for the long tail distribution of home prices we must apply a logarithmic transformation. The normalized distributions have more sensible adjusted means of $586,960 and $668,930.21
Through a Two-Sample T-Test, we find that out of district Donors have a higher normalized mean home price (MN=13.413, SDN= 0.617) than in district Donors (MN= 13.283, SDN = 0.549)22 with a resulting T(769) = 3.096 for a p-val = .002. To estimate the difference between the two groups, we found a 95% CIA of [+0.047, +0.214]. Converted, this predicts a true difference of [$29,274, $149,772] for the mean out of district price, an increase of between 4.7% and 23.9% from the mean in district home price.
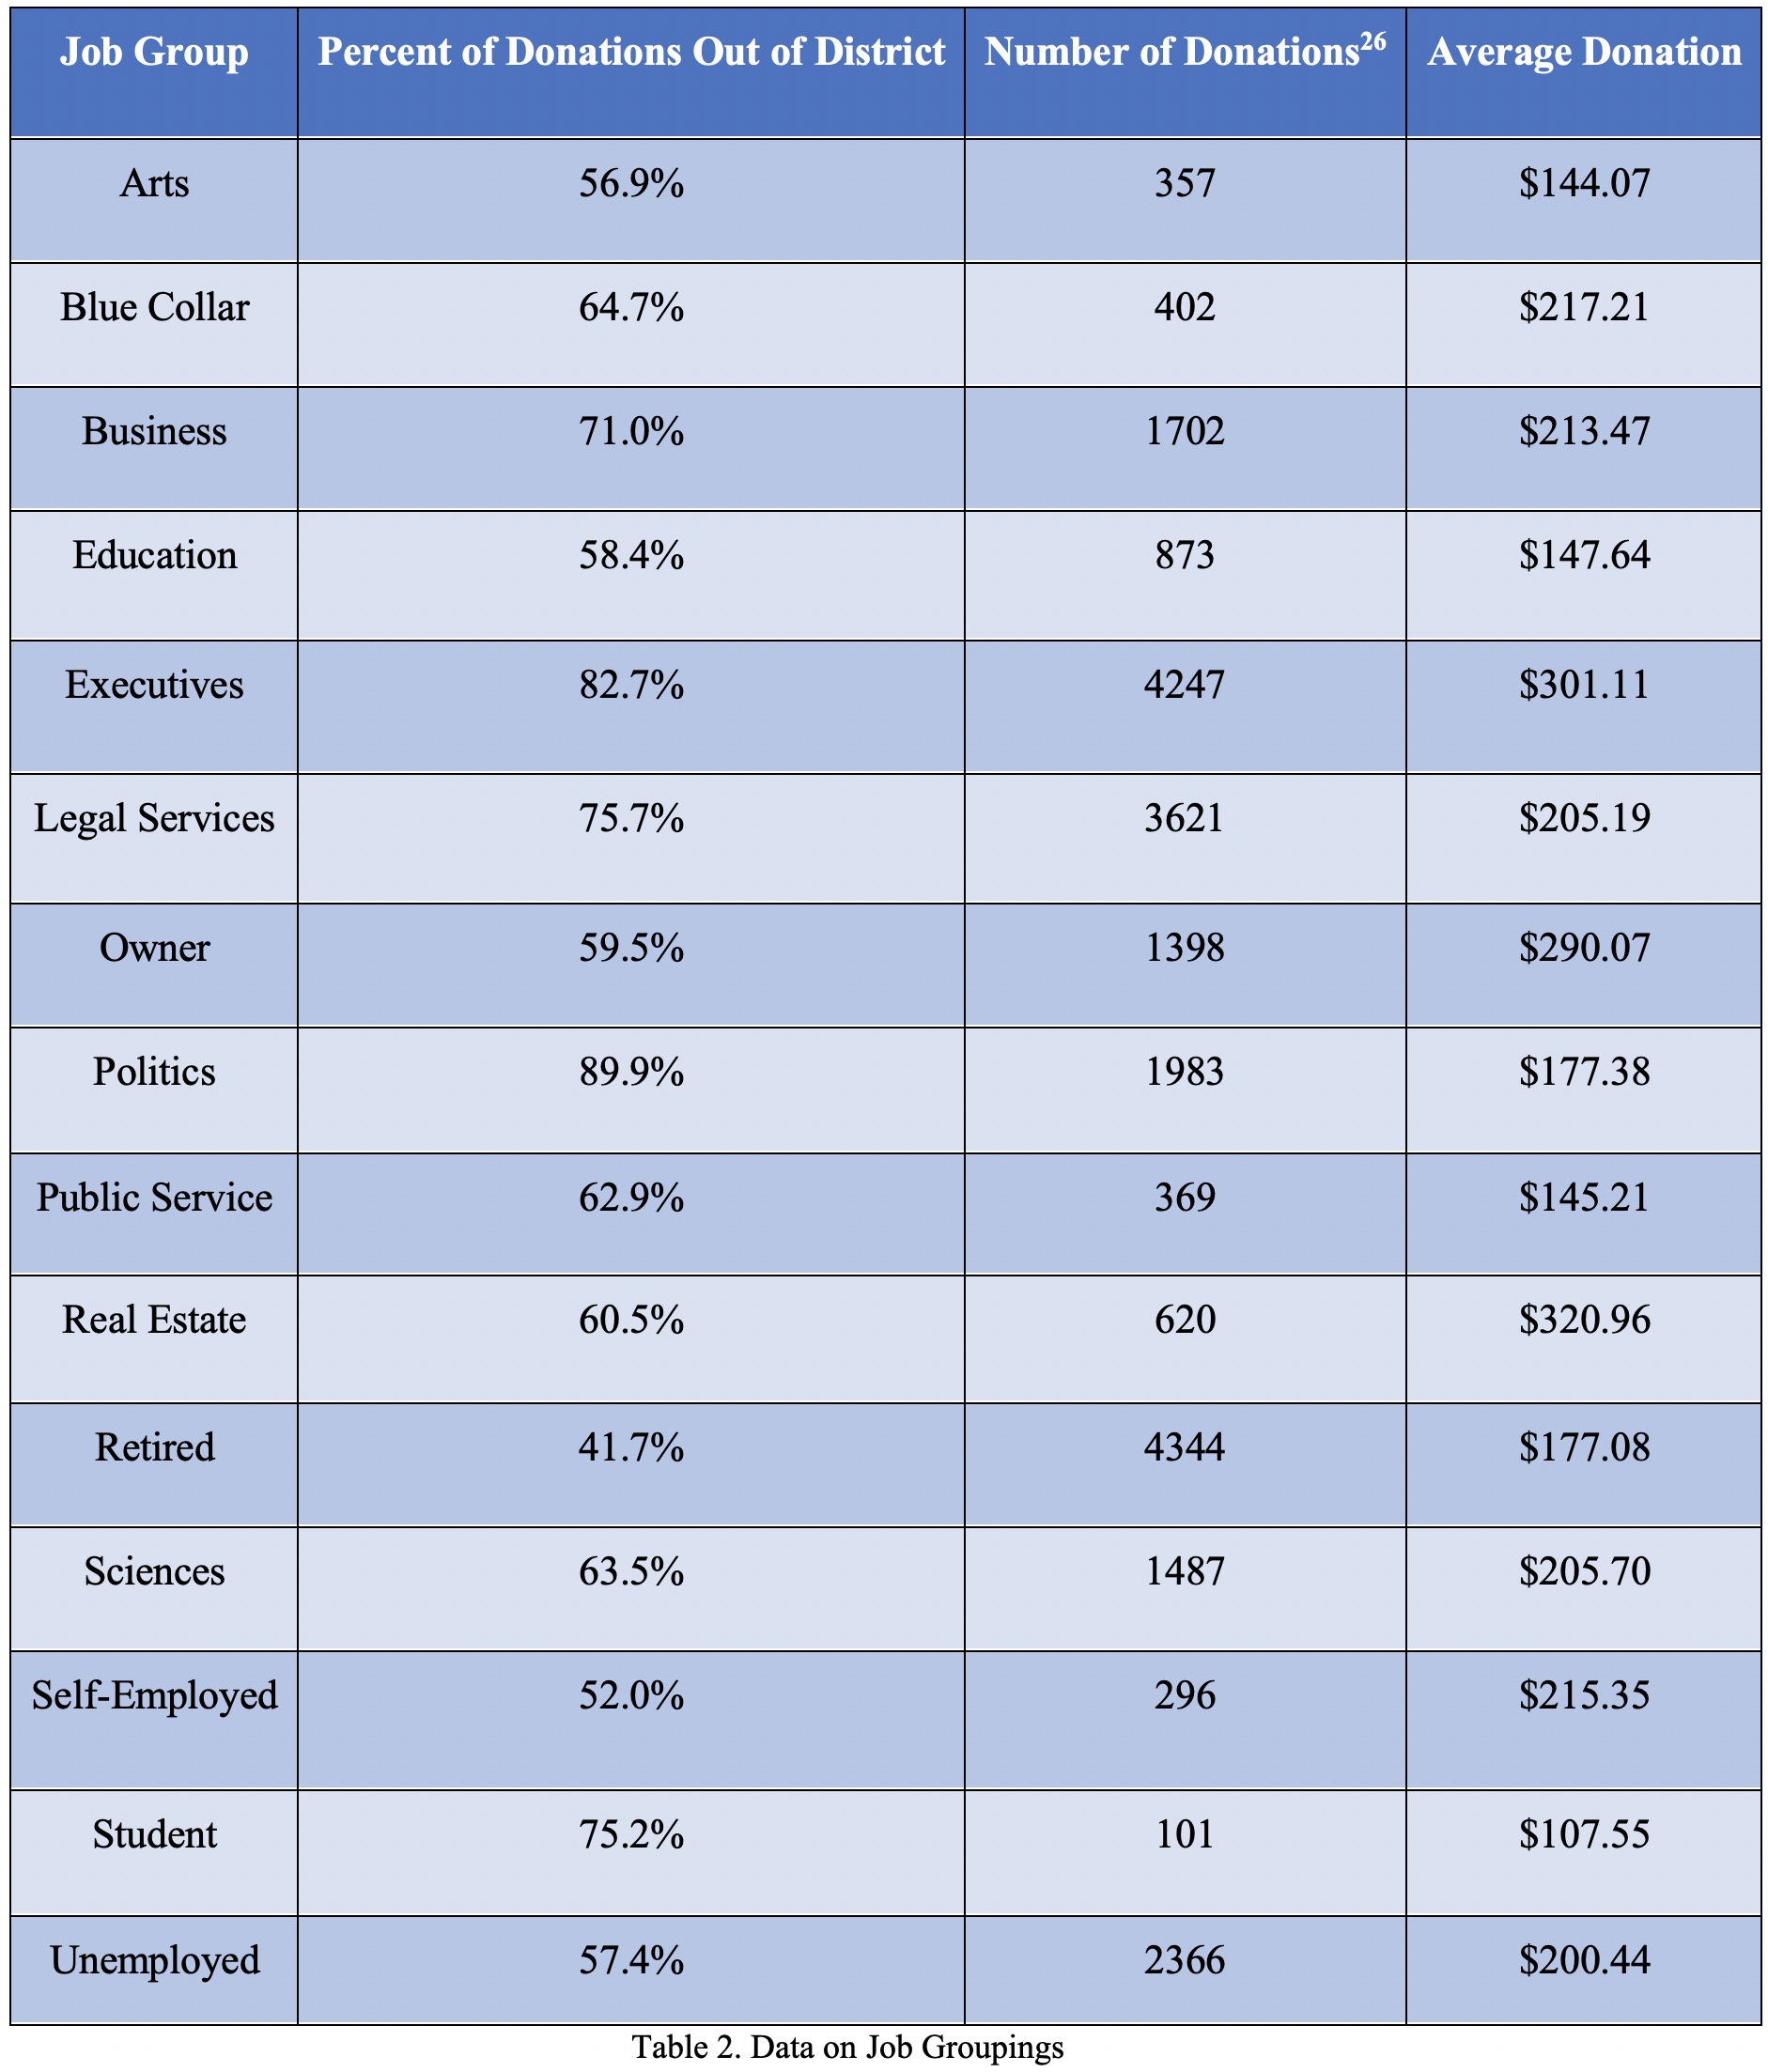
To summarize, our analysis reveals that out of district contributions are higher in value and out of district donors are wealthier. While the test does not explore the origin of these trends, we are inclined to think that they are likely due to candidates seeking out (directly or indirectly) wealthier donors or wealthier donors seeking to assist candidates whose platforms they agree with. Either way, these findings present a concerning trend that out of district contributions coming from wealthier individuals have a major impact on campaign fundraising. OccupationalApproximately 60.2% of individuals self-reported their occupations when making contributions to the Massachusetts House of Representative candidates. The limitations and constraints of this data are discussed in the methodology section. Under the assumption that the self-reported occupations are valid, we seek to identify the relationship one’s occupation has on their out of district contribution behavior. We categorize the 200 most popular jobs and place all the contributions from those occupations into one of fifteen categories. We then calculate the intra-group out of district proportions reported in Table 2. To identify the significance of the effect of occupation on out of district proportion, we use an ANOVA test. The test reveals a significant effect of occupation group on out of district contribution proportion at the p < .05 level for the 15 conditions [F(14, 24151) = 16.24, p < .001]. This finding confirms that one’s occupation has a significant impact on their out of district contribution behavior; the full extent of this behavior is described in Table 2.
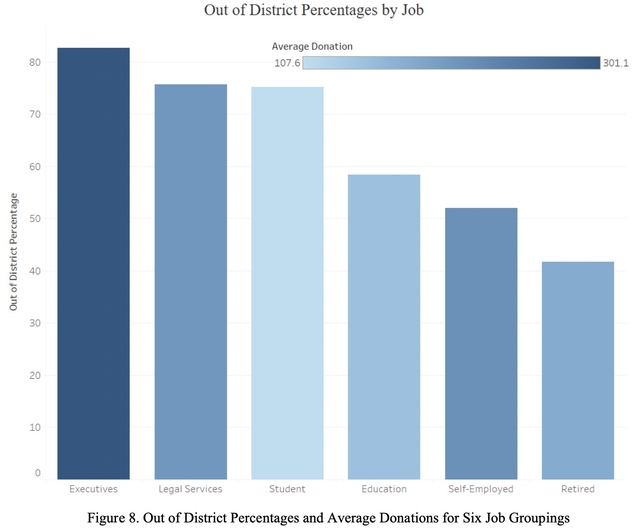
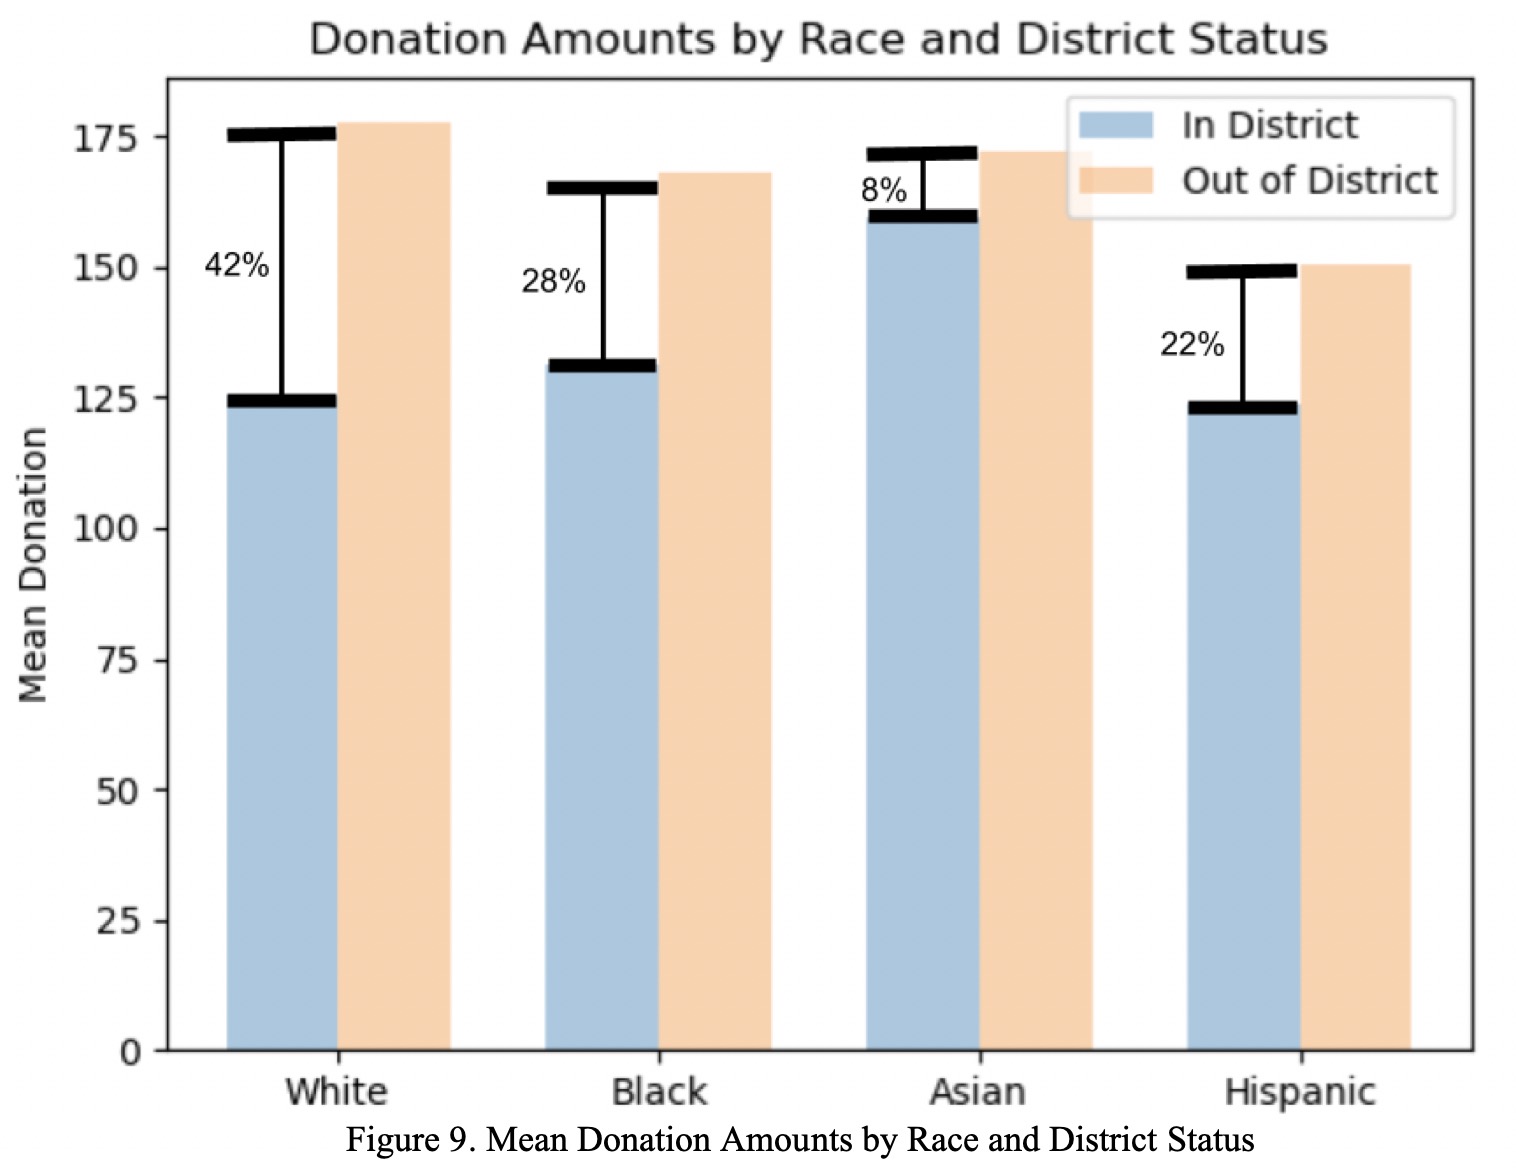
As seen in Table 2 more than 50% of the contributions are out of district for all but one job group. However, the important conclusions are drawn not from examining the similarities between the groups but from examining the differences. Figure 8 consists of the job groups with some of the highest and lowest percentages of contributions from outside of their district. In the previous economic section, we concluded that wealthier individuals contribute a higher proportion of their contributions outside of their district. In addition, we confirmed the positive relationship between wealth and average contribution. Both conclusions are further supported by Table 2. Occupational groups that would intuitively be considered higher paying such as executives and owners contribute more on average ($301.11, $290.07) than lower-paying groups such as arts and education ($144.07, 147.64). In addition, there seems to be a weak positive relationship between the assumed salary of a job group and their out of district proportion, but there are notable inconsistencies. These inconsistencies give us a deeper understanding of the behavior and motivation of out of district donors, and they lead us to believe that wealth is not the only predictor of out of district proportion. As a result of the inconsistencies in the positive relationship between imagined salary and proportion of out of district contributions, we are forced to make an important distinction between the ‘nature of a job’ and the ‘assumed salary’ of a job. To further clarify, the ‘nature of a job’ considers the characteristics of the occupation that are unrelated to its salary. We believe that the nature of an individual's job combined with their wealth has a strong predictive influence on one’s out of district contribution behavior. An example of this distinction is the job groups of students and politics. If we simply believed that the only predictor of out of district proportion was wealth, then we would have concluded that both groups have a low proportion of out of district donations. However, the table shows us that these groups have two of the highest out of district percentages. This conclusion makes sense only when also considering the nature of the occupations. Students often do not live in their home district and people in the political sphere are often colleagues with candidates running outside of their district. These are just a few of the many characteristics of the two groups that justify their high out of district proportion. The table leads us to believe that people who work in occupational groups that are characteristically more invested, financially or emotionally, in their home district are more likely to contribute to candidates running inside of their district. For example, one can intuitively reason why educators, self-employed individuals, and retirees are more connected to their home district than executives and lawyers. Except for people working in politics, the data also suggests that workers in the public sector have a lower tendency to donate out of district than those in the private sector. These points can be summarized by stating that people who are more impacted by the governmental decisions made for their home district are less likely to donate outside of their district. The converse is also true - people who are not as affected by the policies enacted in their district are more likely to donate outside of their district. The democratic implications of this phenomenon are dangerous. The data suggests that the voice of constituents who are heavily affected by local policy is being drowned out by the social capital of individuals who live outside of the district they are influencing. RacialThe last disparity that we explore is the racial inequality present in out of district contributions. With the racial probability distributions generated from BISG we can calculate a variety of summary statistics to better understand the impact of race on donor behavior. The first point of interest is the disparity in amounts donated by different groups. Figure 9 shows the mean donation amounts by race stratified by in district and out of district contributions.
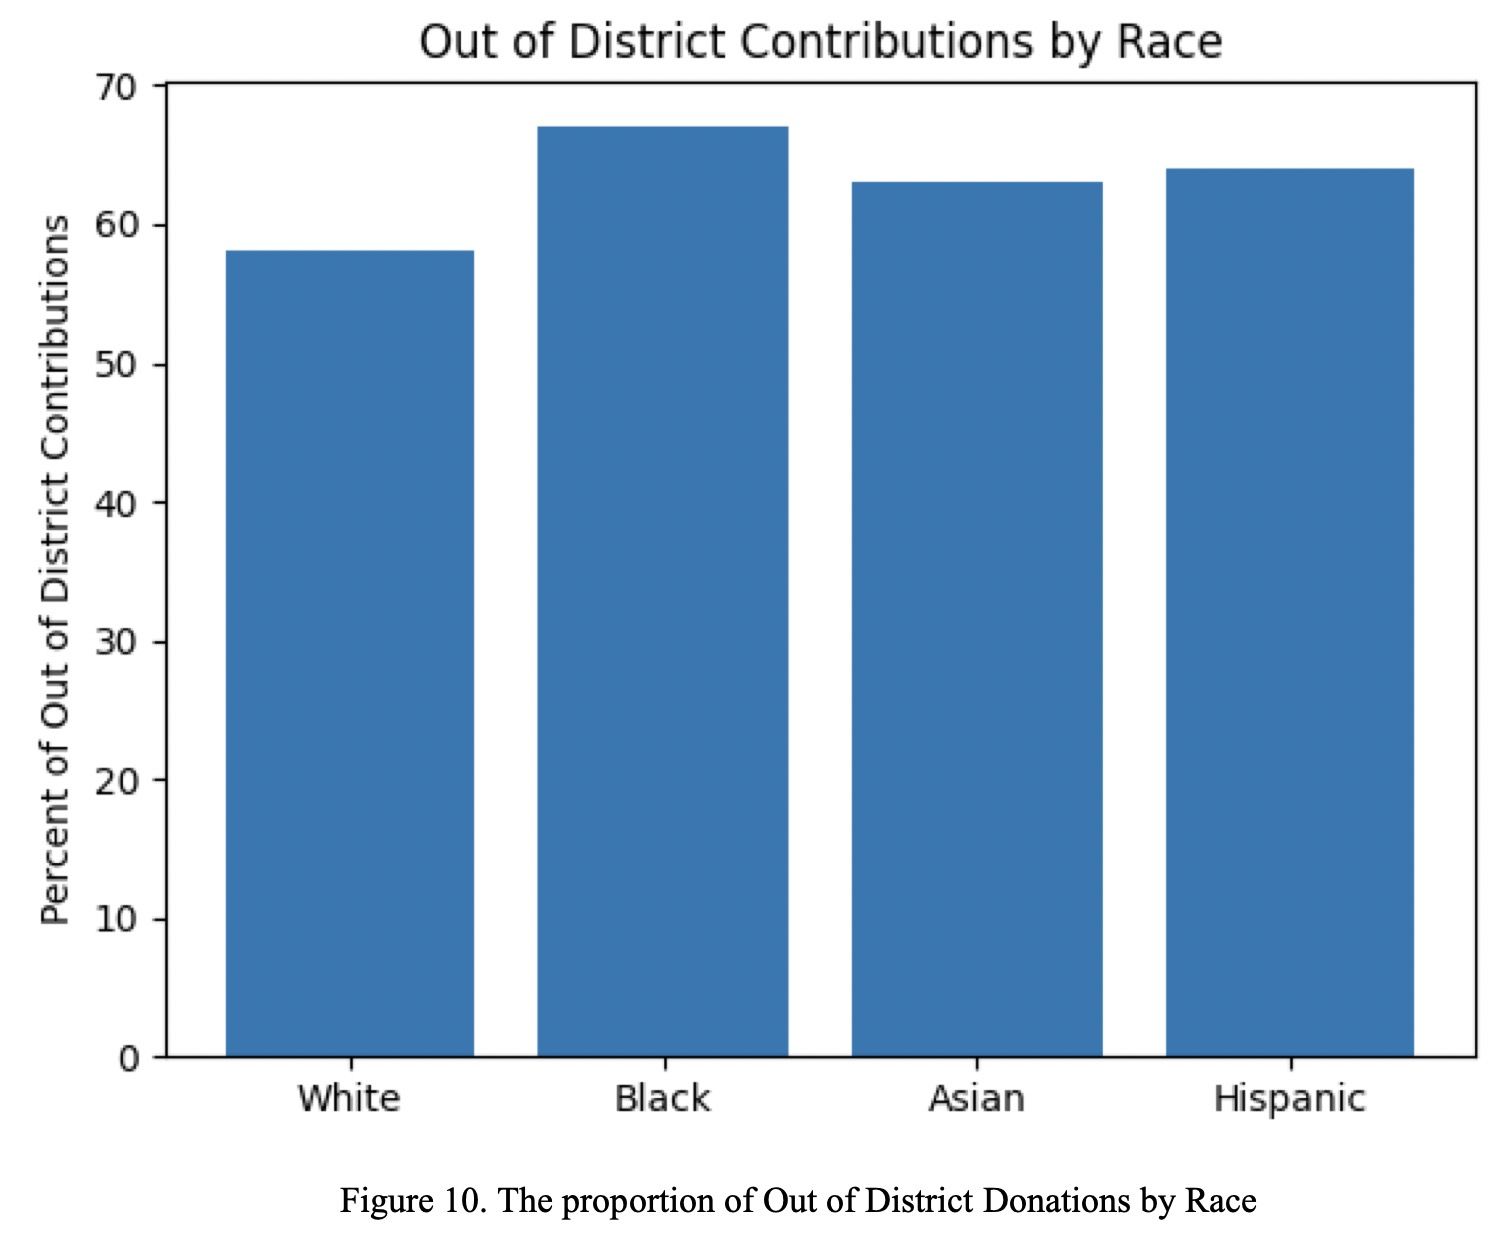
As seen in Figure 9, each of the three minority groups studied has lower average out of district contributions than whites. More importantly, the minority groups’ amounts all have a smaller difference between the value of in district and out of district donations. While the average white out of district donation is 42% more than the average white in district donation, the average Black, Asian, and Hispanic donations are only 28%, 8%, and 22% more than their average in district contributions, respectively. This indicates that white individuals contribute significantly higher amounts when donating to outside elections in comparison to candidates in their own district. We believe that this pattern could be a result of the historic socio-political factors that allow white people to treat politics as a hobby, while minority races must take action to ensure that their rights are preserved. However, when considering the total number of donations of minority groups as a whole, we see a different pattern. Figure 10 shows the proportion of out of district donations by race.
Whites donated to elections outside of their district in 58% of their contributions. Interestingly, minority groups had slightly higher out of district donation rates: Asians at 63%, Hispanics at 64%, and Blacks at 67%. An explanation for the slight difference can be found in the tendency for minority groups to support candidates of the same race. The top recipients for out of district contributions by Black, Asian, and Hispanic donors are all Black, Asian, and Hispanic candidates, respectively. Liz Miranda, a Black woman from the Fifth Suffolk District received 39.9% of her 715 out of district contributions from Black donors. Rithy Uong, an Asian, ran for the 18th Middlesex district with 67.2% of her 154 out of district contributions from Asians. William Lantigua, a Hispanic from the 16th Essex District received 70.5% of his 190 out of district contributions from Hispanics24 (see Appendix F for more on the racial distribution of candidates’ donor bases). Situations like these help explain why minority races tend to donate out of district more frequently, even though the amounts are less significant. The historical underrepresentation of minorities in American Politics may incline minority citizens to donate to candidates who represent their racial group, even if they do not have the financial resources to make a large contribution. This indicates a duality of out of district contributions for minority groups. While their contribution efforts are partially diluted by large out of district contributions from whites, out of district donations also enable minority groups to support candidates who will represent them, even if they are in a different district. DiscussionWhile our paper explains the variation within the distributions of out of district and in district donations, we also want to address the factors that motivate an individual to contribute to a political campaign outside of their district. In order to effectively regulate out of district campaign fundraising, we need to understand the factors that drive individuals to contribute to these races. We believe that the interaction between one’s economic, occupational, and racial identities motivate an individual to contribute inside or outside their district. Our economic findings present clear evidence that wealthier individuals contribute outside of their district at a significantly higher rate than poorer individuals. We also conclude that the average out of district contribution is 41% higher than the average in district contribution. As a result of these findings, we believe that one factor motivating an individual to contribute outside of their district is disposable income: those with more resources are more likely to contribute out of district. In contrast, we believe that individuals who have less disposable income need to prioritize their own home district, and they do not have the extra money to spend on outside races. In some cases, this disposable income allows out of district donors to contribute large amounts to gain political influence with candidates. The lack of grassroots out of district contributions suggests that these donors may be less interested in helping the candidate’s community and more interested in gaining political influence. Our occupational findings also support the idea that out of district donors are contributing to gain political influence. In some cases, the nature of one’s occupation can motivate them to bolster ties with candidates through out of district contributions. For example, executives may attend more gatherings with state officials and have connections with influential people outside of their district. In addition, people who work in politics as lobbyists or staffers interact with representatives outside of their district frequently. One can intuitively reason why it is more important for lobbyists and executives to have political influence than other occupations such as teachers and retirees. Our occupational and economic findings suggest that the desire for political influence, driven by one’s job and wealth, can motivate an individual to contribute outside of their district. Another insight gained from our occupational data is the effect of location on a donor’s decision to contribute outside of their district. For example, students often attend college outside of their home district and are likely to move away from home upon graduation. In contrast, retirees are more likely to stay in their home district for an extended period. The amount of time someone is expecting to live in their current district can dictate the level of impact their local state representative has on their life and therefore motivate them to donate in or out of their district. Our racial findings indicate a new motivation: contributing out of necessity. When investigating the average donation amounts by race and district, we see that whites increase their average contributions by 42% when donating out of district, compared to just 19% for minorities. This trend reflects the ability for white people to treat politics as a hobby, donating to whoever they want without worrying about any repercussions to their individual rights. For many minority individuals, the impact of a local legislator is far more significant as they have the power to mitigate racial inequality in the community. The disparity between out of district contribution increases is concerning as it gives white people an unfair influence over candidates from other districts. However, there is a duality in the racial implications of out of district donations. The fact that minority candidates have high proportions of minority out of district donors indicates another motivation: homophily. Regardless of district, people of color have a tendency to support candidates of their race. In this scenario, out of district donations allow underrepresented groups to have a political voice. And though they may not be represented directly by that candidate, more diversity in the state legislature will help introduce policy fighting against marginalization. Ironically, while most out of district contributions dilute the representation of in district contributors, a select few help facilitate representation for the most marginalized groups. Out of district contributions are not inherently bad, but they are dominated by privileged individuals who are not as impacted by the results of their actions. This nuance should be taken into consideration when making political decisions. ConclusionRegardless of motivation, the disproportionate influence of out of district donations in Massachusetts state elections raises an important ethical question. How do we minimize the effects of economic, occupational, and racial inequalities on donor behavior to protect our representative democracy? From a quantitative viewpoint we conclude that the most ethical policy would be to limit the total amount out of district contributions allowed for a candidate’s election cycle. Any limiting regulation would ensure that candidates do not rely solely on economically and occupationally privileged out of district donors. By limiting, not banning, we would preserve the right of minority citizens to support underrepresented candidates. ReferencesBaude, W. (2014, September 22). Is there a right to contribute to out-of-state elections? Retrieved from https://www.washingtonpost.com/news/volokh-conspiracy/wp/2014/09/22/is-there-a-right-to-contribute-to-out-of-state-elections/ Bluman v. Federal Election Commission., 800 F. Supp. 2d 281 (D.D.C. 2011). Brief of the National Voting Rights Institute as Amicus Curiae Supporting the Defendants-Appellants at 18, VanNatta v. Keisling, 151 F.3d 1215 (9th Cir. 1998) (Nos. 95-35998, 95-35999) Bulman-Pozen, J. (2013). Partisan Federalism. Harvard Law Review, 127. Retrieved August 9, 2020. Citizens United v. Federal Election Commission, 558 U.S. 310 (2010). Formisano, R. (1991). Boston Against Busing: Race, Class, and Ethnicity in the 1960s and 1970s. University of North Carolina Press. Retrieved August 23, 2020, from http://www.jstor.org/stable/10.5149/9780807869703_formisano. Garry, P. M., Nelsen, D. A., & Spurlin, C. J. (2010). Raising the Question of Whether Out-of-State Political Contributions May Affect a Small State's Political Autonomy: A Case Study of the South Dakota Voter Referendum on Abortion. South Dakota Law Review. Retrieved August 17, 2020. Gooch, A. A., & Huber, G. A. (2018). How Issue Positions Affect Candidate Performance: Experiments Comparing Campaign Donors and the Mass Public. Political Behavior, 42(2). doi:10.1007/s11109-018-9506-0. Grenzke, J. (1988). Comparing Contributions to U. S. House Members from outside Their Districts. Legislative Studies Quarterly, 13(1), 83. doi:10.2307/439946 In-State vs. Out-of-State Donations. (2017, November 27). Retrieved August 9, 2020, from https://www.opensecrets.org/elections-overview/in-state-vs-out-of-state?cycle=2016 McCammond, A., & Stevens, H. (2018, August 27). Most campaign contributions come from outside candidates' districts. Retrieved August 9, 2020, from https://www.axios.com/house-campaign-contributions-outside-money-f776be9e-f74b-4834-8ff4-ae30df1f7c61.html McCutcheon v Federal Election Commission, 572 U.S. 185 (2014). Pettys, T. E. (2017). Campaign Finance, Federalism, and the Case of the Long-Armed Donor. University of Chicago Law Review Online, 81(1), 4th ser. Retrieved August 9, 2020, from https://chicagounbound.uchicago.edu/cgi/viewcontent.cgi?article=1029&context=uclrev_online. Ross, S. (2019, July 16). Jones latest finance report: 88% of funds from out-of-state again. Retrieved August 9, 2020, from https://yellowhammernews.com/jones-latest-finance-report-88-of-funds-from-out-of-state-again/ Stevens, J. P. (2014, September 12). Oops! Lecture presented at Administrative Law Section of the D.C. Bar 2014 Harold Leventhal Lecture, Washington D.C. Retrieved August 9, 2020, from https://www.supremecourt.gov/publicinfo/speeches/JPS Speech(DC)_09-12-2014.pdf. Using publicly available information to proxy for unidentified race and ethnicity. (2014). Consumer Financial Protection Bureau. Retrieved August 17, 2020. Vannatta v. Keisling, 899 F. Supp. 488 (D. Or. 1995). Walters, Q. (2020, June 12). Boston Mayor Declares Racism A Public Health Crisis. Retrieved August 23, 2020, from https://www.npr.org/sections/live-updates-protests-for-racial-justice/2020/06/12/876327158/boston-mayor-declares-racism-a-public-health-crisis. Endnotes1.) This source was last updated August 28th, 2018, ahead of the 2018 elections 2.) The Massachusetts OCPF is an independent state agency that administers Massachusetts campaign finance laws and files disclosure reports. 3.) The dataset can be found at: https://www.ocpf.us/Reports/SearchItems 4.) The Massachusetts OCPF has donations for all statewide, legislative, county and district offices, Governor's Council candidates, but our analysis only examined state senate and state representative candidates. 5.) The Massachusetts OCPF database makes distinctions between individual donations and organizational donations 6.) By “district status,” we mean whether or not the donation was made by someone who lives inside or outside the district where the race is occurring. 7.) See Appendix A 8.) Nominatim python module-https://nominatim.org/ 9.) Shapefile map-https://docs.digital.mass.gov/dataset/massgis-data-massachusetts-house-legislative-districts 10.) See Appendix B 11.) PLA: https://rosettacode.org/wiki/Ray-casting_algorithm 12.) Zillow Zestimate Info: https://www.zillow.com/zestimate/ 13.) See Appendix D 14.) See “Boston Against Busing: Race, Class, and Ethnicity in the 1960s and 1970s” by Ronald P. Formisano and “Boston Mayor Declares Racism A Public Health Crisis” by Quincy Walters 15.) Link to BISG Report: https://files.consumerfinance.gov/f/201409_cfpb_report_proxy-methodology.pdf 16.) Census API surname page: https://www.census.gov/data/developers/data-sets/surnames.html 17.) Races by town: http://archive.boston.com/news/local/massachusetts/graphics/03_22_11_2010_census_town_population/ 18.) Races by boston district: https://data.boston.gov/dataset/neighborhood-demographics 19.) See Appendix C and Appendix D 20.) “r|s” is racial probability by surname, “g|r” is the geographical probability by race, “R” is the set of races 21.) See Figure 7 22.) Where M = Mean, SD = Standard Deviation, XA= X Normalized with Natural Log 23.) Note that the number of jobs may be impacted by response bias. They are present only to indicate sufficient data. 24.) This analysis was done on candidates with over 300 total contributors to ensure BISG convergence. Appendix
From the Inquiries Journal Blog ")  Related ReadingMonthly Newsletter SignupThe newsletter highlights recent selections from the journal and useful tips from our blog. Suggested Reading from Inquiries Journal
Inquiries Journal provides undergraduate and graduate students around the world a platform for the wide dissemination of academic work over a range of core disciplines. Representing the work of students from hundreds of institutions around the globe, Inquiries Journal's large database of academic articles is completely free. Learn more | Blog | Submit Follow IJ
Latest in Political Science |