|
Featured Article: The Effect of Dodd-Frank on the Profitability of Community Banks: An Econometric Model
By examining explanatory variables for 82 banks in the years 2010-2014 factors affecting each dependent variable have been determined. Return on Equity is influenced negatively by growth of total deposits, cost efficiency, bank loan portfolio, non-performing loans, interest rate, and FRASE index, and positively affected by credit quality, assets, and real GDP. Return on Assets is influenced positively by the net interest margin, credit quality, and real GDP, and negatively by the FRASE index, non-performing loans, cost efficiency, and growth of total deposits. The Net Interest Margin is influenced negatively by inflation, and the interest rate and positively by non-performing loans. According to the models, there has been an impact on the profitability of banks since the enactment of the Dodd-Frank Act. This is evidenced by the negative correlation between profitability and the FRASE index. This correlation indicates that more regulation in a state decreases bank profitability. In addition, there was a positive correlation between asset size and profitability. This is interpreted as the smaller a bank is, the less profitable it will be. To conclude, a small bank and regulations will both negatively impact profitability. These findings are similar to findings by Naceur and Omran (2011). The Dodd-Frank Act requires more liquidity and there is evidence that holding deposits negatively affects profitability. However, the Dodd-Frank Act may have impacted the credit quality of banks and increased the quality of loans held. There is evidence that high quality loans increase profitability.
This study was based on the premise that the Dodd-Frank Act affects each of the explanatory variables and that these variables determine a bank’s return on equity, return on assets, and net interest margin. This study may be subject to omitted variable bias as there are many factors which may impact a bank’s profitability which were not included. It may be beneficial for future researchers to look into other regulations and their effects on different industries. In addition, sometime macroeconomic data is logged, however, it is not in this study. It may behoove a researcher to see if the data becomes more significant if it is logged. The economy was still recovering from a recession for the years available to sample; a more accurate study may be possible after the economy has recovered for a longer period. Eighty-two banks were used for this study, for future studies, larger and separate samples of community and non-community banks might lead to more accurate results.
Al-Ubaydli, O. & McLaughlin, P.A. (2015). RegData: A numerical database on industry-specific regulations for all United States industries and federal regulations, 1997-2012. Regulation & Governance, doi: 10.1111/rego.12107.
Arellano, M. & Bond, S. (1991). Some tests of specification for panel data: Monte Carlo evidence and an application to employment equations. Review of Economic Studies, 58.2, 277–297.
Athanasoglou, P. P., Brissimis, S. N., & Delis, M. D. (2008). Bank-specific, industry-specific and macroeconomic determinants of bank profitability. Journal of International Financial Markets, Institutions and Money, 18.2, 121-136.
Bloomberg L.P. (2015). Data. Retrieved from Bloomberg database.
Blundell, R. & Bond, S. (1998). Initial conditions and moment restrictions in dynamic panel data models. Journal of Econometrics, 87, 115-143.
Board of Governors of the Federal Reserve System (US), 30-Year Conventional Mortgage Rate© [MORTG], retrieved from FRED, Federal Reserve Bank of St. Louis https://research.stlouisfed.org/fred2/series/MORTG, April 25, 2016.
Dietrich, A., & Wanzenried, G., (2011). Determinants of bank profitability before and during the crisis: Evidence from Switzerland. Journal of Financial Markets, Institutions and Money, 21.3, 307-327.
Evans, L. (2012). Impact of the Dodd-Frank Act Depends Largely on Future Rule Making. United States Government Accountability Office, 12. N.p.
Federal Deposit Insurance Corporation. (2015). Deposit Market Share Reports. Retrieved from https://www5.fdic.gov/sod/sodMarketBank.asp?barItem=2
Kanas, A., Vasiliou, D., & Erotis, N. (2012). Revisiting bank profitability: A semi-parametric approach. Journal of International Financial Markets, Institutions and Money, 22.4, 990-1005.
Lux, M., & Greene, R. G. (2015). The State and Fate of Community Banking. Harvard Kennedy School. N.p.
Marsh, T. D., & Norman, J. W. (2012). The Impact of Dodd-Frank on Community Banks. Wake Forest University Legal Studies, Paper No. 2302392.
Naceur, S. B., & Omran, M. (2011). The Effects of Bank Regulations, Competition, And Financial Reforms on Banks' Performance. Emerging Markets Review, 12.1, 1-20.
Ozkan, S., Balsari, C. K., & Varan, S. (2014). Effect of Banking Regulation On Performance: Evidence from Turkey. Emerging Markets Finance & Trade, 50.4, 196-211.
Pierce, H., Robinson, I., & Stratmann, T. (2014). How Are Small Banks Faring Under Dodd-Frank?" George Mason University, N.p.
Pierce, H., & Miller, S. M. (2015). Small Banks by the Numbers. Mercatus Center, 2000–2014. N.p.
US. Bureau of Labor Statistics. Consumer Price Index for All Urban Consumers: All Items [CPIAUCSL], retrieved from FRED, Federal Reserve Bank of St. Louis. https://research.stlouisfed.org/fred2/series/CPIAUCSL, April 25, 2016.
US. Bureau of Economic Analysis. Real Gross Domestic Product [A191RL1Q225SBEA], retrieved from FRED, Federal Reserve Bank of St. Louis. https://research.stlouisfed.org/fred2/series/A191RL1Q225SBEA, April 25, 2016.
| Bank Code |
Bank Name |
State |
Community Bank |
| 1 |
Peoples United Bank |
CT |
No |
| 2 |
Webster Bank |
CT |
No |
| 3 |
PB Bancorp, Inc |
CT |
Yes |
| 4 |
Salisbury Bancorp, Inc. |
CT |
Yes |
| 5 |
SI Financial Group, Inc. |
CT |
Yes |
| 6 |
United Financial Bancorp, Inc. |
CT |
Yes |
| 7 |
Boston Private Financial Holdings, Inc. |
MA |
Yes |
| 8 |
Bershire Hills Bancorp, Inc. |
MA |
Yes |
| 9 |
Brookline Bancorp, Inc. |
MA |
Yes |
| 10 |
Chicopee Bancorp, Inc. |
MA |
Yes |
| 11 |
Century Bancorp, Inc. |
MA |
Yes |
| 12 |
Meridian Bancorp, Inc. |
MA |
Yes |
| 13 |
Enterprise Bank and Trust Company |
MA |
Yes |
| 14 |
Independent Bank Corp/MA |
MA |
Yes |
| 15 |
Westfield Finanacial, Inc |
MA |
Yes |
| 16 |
Bar Harbor Bank & Trust |
ME |
Yes |
| 17 |
Camden National Corporation |
ME |
Yes |
| 18 |
First Bancorp, Inc. |
ME |
Yes |
| 19 |
Northeast Bancorp |
ME |
Yes |
| 20 |
Lake Sunapee Bank Group |
NH |
Yes |
| 21 |
Hudson City Bancorp |
NJ |
No |
| 22 |
Valley National Bancorp |
NJ |
No |
| 23 |
BCB Bancorp Inc |
NJ |
Yes |
| 24 |
First Constitution Bancorp |
NJ |
Yes |
| 25 |
Cape Bancorp, Inc. |
NJ |
Yes |
| 26 |
ConnectOne Bancorp |
NJ |
Yes |
| 27 |
Lakeland Bancorp |
NJ |
Yes |
| 28 |
Maguyar Bancorp, Inc |
NJ |
Yes |
| 29 |
Northfield Bancorp, Inc. |
NJ |
Yes |
| 30 |
OceanFirst Financial Corp. |
NJ |
Yes |
| 31 |
Oritani Financial Corp |
NJ |
Yes |
| 32 |
Ocean Shore Holding Co. |
NJ |
Yes |
| 33 |
Providnet Financial Services, Inc |
NJ |
Yes |
| 34 |
Peapack-Gladstone Financial |
NJ |
Yes |
| 35 |
Parke Bancorp |
NJ |
Yes |
| 36 |
Sussex Bancorp |
NJ |
Yes |
| 37 |
Stewardship Financial Corporation |
NJ |
Yes |
| 38 |
Two River Bancorp |
NJ |
Yes |
| 39 |
Unity Bancorp, Inc |
NJ |
Yes |
| 40 |
Bank of NY Mellon |
NY |
No |
| 41 |
Citigroup |
NY |
No |
| 42 |
First Niagara Financial Group Inc. |
NY |
No |
| 43 |
M&T Bank Corp |
NY |
No |
| 44 |
New York Community Bancorp, Inc |
NY |
No |
| 45 |
JPMorgan Chase & Co |
NY |
No |
| 46 |
Signature Bank |
NY |
No |
| 47 |
The Bridgehampton National Bank |
NY |
Yes |
| 48 |
Financial Institutions |
NY |
Yes |
| 49 |
TrustCo Bank Corp |
NY |
Yes |
| 50 |
Arrow Financial Corp |
NY |
Yes |
| 51 |
Chemung Financial Corp |
NY |
Yes |
| 52 |
First of Long Island Corp |
NY |
Yes |
| 53 |
Flusing Financial Corp |
NY |
Yes |
| 54 |
Suffolk Bancorp |
NY |
Yes |
| 55 |
Tompkins Financial Corp |
NY |
Yes |
| 56 |
FNB Corp |
PA |
No |
| 57 |
Fulton Financial Corp |
PA |
No |
| 58 |
PNC Financial Services Group |
PA |
No |
| 59 |
Bryn Mawr Bank Corp |
PA |
Yes |
| 60 |
First Commonwealth Financial Corp |
PA |
Yes |
| 61 |
Orrstown Financial Services, Inc |
PA |
Yes |
| 62 |
S&T Bancorp Inc |
PA |
Yes |
| 63 |
Univest Corp of Pennsylvania |
PA |
Yes |
| 64 |
ACNB Bank |
PA |
Yes |
| 65 |
AmeriServ Financial Inc. |
PA |
Yes |
| 66 |
Beneficial Bancorp Inc |
PA |
Yes |
| 67 |
CNB Financial Corp |
PA |
Yes |
| 68 |
Codorus Valley Bancorp |
PA |
Yes |
| 69 |
First Citizens Community Bank |
PA |
Yes |
| 70 |
DNB First, National Association |
PA |
Yes |
| 71 |
The Fidelity Deposit and Discount Bank |
PA |
Yes |
| 72 |
First Keystone Community Bank |
PA |
Yes |
| 73 |
Republic First Bancorp, Inc |
PA |
Yes |
| 74 |
Fox Chase Bancorp, Inc. |
PA |
Yes |
| 75 |
Mid Penn Bank |
PA |
Yes |
| 76 |
National Penn Bancshares |
PA |
Yes |
| 77 |
Northwest Bancshares |
PA |
Yes |
| 78 |
Norwood Fianncial Corp |
PA |
Yes |
| 79 |
Prudential Bancorp |
PA |
Yes |
| 80 |
Penns Wood Bancorp |
PA |
Yes |
| 81 |
QNB Bank |
PA |
Yes |
| 82 |
Royal Bancshares of Pennsylvania, Inc |
PA |
Yes |
| Variable |
Measure |
Notation |
Expected Effect |
| Return on Equity |
Net income / average common equity |
ROE |
|
| Return on Assets |
Net income / average assets |
ROA |
|
| Net Interest Margin |
Net interest income / earnings assets |
NIM |
|
| Bank Code |
Corresponding code with each bank's name |
BCode |
? |
| Time Code |
Corresponding code with each time period |
TCode |
? |
| Community Bank Status |
<10 billion in assets is considered a community bank |
BankStatus |
- |
| Total Deposit Growth |
The percentage change over a one year period of total deposits |
TotDepG |
? |
| Interest Income Share |
The percentage of interest based income divided by non-interest income |
IntIncShare |
? |
| Cost Efficiency |
Total operating expenses / total revenue + total deposits |
CostEff |
- |
| Credit Quality |
Reserve for loan loss / total loans |
CreditQual |
+ |
| Diversification |
(Non-interest income / gross income)^2 / (interest income / gross income)^2 |
Div |
? |
| Bank Portfolio |
Total consumer loans / total commercial loans |
BankPort |
? |
| Non-performing loans |
Sequential growth from year before of loans in default (that do not accrue interest) |
NonPerG |
- |
| Herfindahl-Hirschman Index |
The market shares of each state that the bank are headquartered |
HHI |
? |
| Consumer Price Index |
The percentage change of the CPI lagged one period for all urban consumers in the Northeast |
CPI |
+ |
| Interest Rate |
The percentage change of the 30 year annual interest rate lagged one year |
IntRate |
+ |
| Real Gross Domestic Product |
The percentage change of RGDP each year |
RGDP |
+ |
| Assets |
The bank’s total assets for each year |
ASSETS |
? |
| Log Assets |
The bank’s total assets for each year logged |
LOGASSETS |
? |
| FRASE Current Index |
Ratio of the impact of federal regulations on a specific state’s industry to impact of regulation on the nation |
FRASECUR |
- |
| |
Mean |
Median |
Maximum |
Minimum |
Std. Dev. |
|
| ROA |
0.71 |
0.79 |
2.46 |
-2.87 |
0.54 |
|
| ROE |
6.73 |
7.78 |
26.65 |
-52.44 |
6.81 |
|
| NIM |
3.46 |
3.47 |
6.66 |
1.19 |
0.59 |
|
| CREDITQUAL |
1.45 |
1.32 |
5.98 |
0.00 |
0.66 |
|
| DIV |
2,692,880 |
0.45 |
157,000,000 |
0.00 |
17,352,034 |
|
| BANKPORT |
8.44 |
0.58 |
930.96 |
0.01 |
72.48 |
|
| INTINCSHARE |
6.73 |
4.78 |
163.95 |
-85.37 |
14.32 |
|
| TOTDEPG |
7.59 |
4.97 |
132.46 |
-23.53 |
13.89 |
|
| COSTEFF |
0.01 |
0.01 |
0.03 |
0.00 |
0.00 |
|
| NPLG |
5.78 |
-3.25 |
1871.20 |
-68.95 |
101.93 |
|
| HHI |
970.58 |
769.77 |
1740.00 |
476.11 |
343.48 |
|
| RGDP |
0.02 |
0.02 |
0.03 |
0.01 |
0.01 |
|
| CPI |
0.33 |
0.02 |
1.59 |
-0.13 |
0.63 |
|
| INTRATE |
-0.03 |
-0.13 |
0.33 |
-0.16 |
0.19 |
|
| ASSETS |
64979.82 |
1805.369 |
2572274 |
445.578 |
330234 |
| LOGASSETS |
3.481498 |
3.256504 |
6.410317 |
2.648924 |
0.758645 |
| FRASECUR |
1.18414 |
1.196959 |
1.291662 |
0.892552 |
0.07188 |
| Dependent Variable: |
Return on Equity |
1 |
|
2 |
|
3 |
|
4 |
|
5 |
|
| |
Regressor |
|
|
|
|
|
|
|
|
|
|
| Coefficient |
Lagged ROE |
-0.222379 |
*** |
|
|
|
|
|
|
|
|
| T-Statistics |
|
-4.641318 |
|
|
|
|
|
|
|
|
|
| P-Values |
|
0.0000 |
|
|
|
|
|
|
|
|
|
| |
|
|
|
|
|
|
|
|
|
|
|
| Coefficient |
Growth of Total Deposits |
0.042634 |
*** |
0.017546 |
|
-0.088893 |
*** |
|
|
-0.024719 |
*** |
| T-Statistics |
|
3.120637 |
|
-1.530967 |
|
-2.684342 |
|
|
|
-2.789861 |
|
| P-Values |
|
0.0019 |
|
0.1271 |
|
0.0078 |
|
|
|
0.0057 |
|
| |
|
|
|
|
|
|
|
|
|
|
|
| Coefficient |
Interest Income Share |
0.002709 |
|
0.014365 |
|
|
|
|
|
0.053697 |
* |
| T-Statistics |
|
0.2229633 |
|
1.150026 |
|
|
|
|
|
1.853102 |
|
| P-Values |
|
0.8186 |
|
0.2513 |
|
|
|
|
|
0.0651 |
|
| |
|
|
|
|
|
|
|
|
|
|
|
| Coefficient |
Cost Efficiency |
-204.8525 |
|
-765.8297 |
*** |
|
|
|
|
-722.0357 |
*** |
| T-Statistics |
|
-1.184075 |
|
-7.28034 |
|
|
|
|
|
-4.593356 |
|
| P-Values |
|
0.2376 |
|
0 |
|
|
|
|
|
0.0000 |
|
| |
|
|
|
|
|
|
|
|
|
|
|
| Coefficient |
Credit Quality |
0.744468 |
|
4.740938 |
*** |
1.773751 |
|
2.127958 |
* |
|
|
| T-Statistics |
|
0.953958 |
|
2.654656 |
|
1.473657 |
|
1.914029 |
|
|
|
| P-Values |
|
0.3411 |
|
0.0085 |
|
0.1419 |
|
0.0568 |
|
|
|
| |
|
|
|
|
|
|
|
|
|
|
|
| Coefficient |
Diversification |
4.51E-09 |
|
3.23E-09 |
|
|
|
|
|
|
|
| T-Statistics |
|
0.209837 |
|
0.501367 |
|
|
|
|
|
|
|
| P-Values |
|
0.834 |
|
0.6166 |
|
|
|
|
|
|
|
| |
|
|
|
|
|
|
|
|
|
|
|
| Coefficient |
Bank Loan Portfolio |
0.004794 |
** |
0.000723 |
|
-0.007029 |
*** |
-0.005287 |
*** |
|
|
| T-Statistics |
|
2.214442 |
|
0.159839 |
|
-5.887582 |
|
-11.84652 |
|
|
|
| P-Values |
|
0.0278 |
|
0.8731 |
|
0.0000 |
|
0.0000 |
|
|
|
| |
|
|
|
|
|
|
|
|
|
|
|
| Coefficient |
Non-Performing Loans |
0.001342 |
*** |
-0.001771 |
* |
-0.002343 |
** |
|
|
|
|
| T-Statistics |
|
5.487847 |
|
-1.861327 |
|
-2.081315 |
|
|
|
|
|
| P-Values |
|
0.0000 |
|
0.064 |
|
0.0385 |
|
|
|
|
|
| |
|
|
|
|
|
|
|
|
|
|
|
| Coefficient |
Market Concentration |
-0.003152 |
** |
0.000648 |
|
-0.002475 |
|
0.000163 |
|
|
|
| T-Statistics |
|
-2.410379 |
|
0.297074 |
|
-0.792956 |
|
0.089649 |
|
|
|
| P-Values |
|
0.0167 |
|
0.7667 |
|
0.4286 |
|
0.9286 |
|
|
|
| |
|
|
|
|
|
|
|
|
|
|
|
| Coefficient |
Inflation |
-218.384 |
*** |
-0.114589 |
|
|
|
|
|
|
|
| T-Statistics |
|
-16.29475 |
|
-0.25318 |
|
|
|
|
|
|
|
| P-Values |
|
0.0000 |
|
0.8004 |
|
|
|
|
|
|
|
| |
|
|
|
|
|
|
|
|
|
|
|
| Coefficient |
Interest Rate |
1.152717 |
** |
-2.984662 |
** |
|
|
0.914768 |
** |
|
|
| T-Statistics |
|
2.037336 |
|
-2.318289 |
|
|
|
1.966565 |
|
|
|
| P-Values |
|
0.0428 |
|
0.0213 |
|
|
|
0.0504 |
|
|
|
| |
|
|
|
|
|
|
|
|
|
|
|
| Coefficient |
Change in RGDP |
2.917723 |
*** |
194.0825 |
*** |
|
|
|
|
|
|
| T-Statistics |
|
0.085212 |
|
2.560604 |
|
|
|
|
|
|
|
| P-Values |
|
0.9322 |
|
0.0111 |
|
|
|
|
|
|
|
| |
|
|
|
|
|
|
|
|
|
|
|
| Coefficient |
FRASE Current |
26.20471 |
* |
-84.99074 |
*** |
-15.12968 |
|
|
|
|
|
| T-Statistics |
|
1.694851 |
|
-2.399252 |
|
-0.870833 |
|
|
|
|
|
| P-Values |
|
0.0914 |
|
0.0172 |
|
0.3847 |
|
|
|
|
|
| |
|
|
|
|
|
|
|
|
|
|
|
| Coefficient |
Assets |
|
|
0.0000425 |
|
0.001809 |
*** |
|
|
|
|
| T-Statistics |
|
|
|
0.826166 |
|
2.901016 |
|
|
|
|
|
| P-Values |
|
|
|
0.4096 |
|
0.0041 |
|
|
|
|
|
| |
|
|
|
|
|
|
|
|
|
|
|
| Coefficient |
Log Assets |
-42.43464 |
*** |
|
|
|
|
|
|
|
|
| T-Statistics |
|
-6.355648 |
|
|
|
|
|
|
|
|
|
| P-Values |
|
0.0000 |
|
|
|
|
|
|
|
|
|
| |
|
|
|
|
|
|
|
|
|
|
|
| |
Wald-test (x2) |
154.92 |
|
13.57753 |
|
74.94697 |
|
70.59398 |
|
17.1347 |
|
| |
P-value |
0.0000 |
|
0.0000 |
|
0.0000 |
|
0.0000 |
|
0.0000 |
|
| |
Degrees of Freedom |
(14,232) |
|
(13,233) |
|
(7,239) |
|
(4,242) |
|
(3,243) |
|
| |
AB test AR(1) (p-value) |
0.2542 |
|
0.1213 |
|
0.0002 |
*** |
0.1128 |
|
0.1131 |
|
| |
AB test AR(2) (p-value) |
0.9036 |
|
0.2354 |
|
0.376 |
|
0.2852 |
|
0.2576 |
|
| |
J-statistic |
28.63165 |
|
13.27295 |
|
19.95601 |
|
16.9328 |
|
13.44474 |
|
| Dependent Variable: |
Return on Assets |
1 |
|
2 |
|
3 |
|
4 |
|
5 |
|
| |
Regressor |
|
|
|
|
|
|
|
|
|
|
| Coefficient |
Lagged ROA |
-0.11401 |
*** |
|
|
|
|
-0.163621 |
|
|
|
| T-Statistics |
|
-3.330133 |
|
|
|
|
|
-5.606098 |
|
|
|
| P-Values |
|
0.001 |
|
|
|
|
|
0.0000 |
*** |
|
|
| |
|
|
|
|
|
|
|
|
|
|
|
| Coefficient |
Growth of Total Deposits |
-0.003856 |
*** |
-0.001541 |
|
-0.001688 |
** |
|
|
|
|
| T-Statistics |
|
-6.394816 |
|
-1.519691 |
|
-1.96318 |
|
|
|
|
|
| P-Values |
|
0.000 |
|
0.1300 |
|
0.0508 |
|
|
|
|
|
| |
|
|
|
|
|
|
|
|
|
|
|
| Coefficient |
Interest Income Share |
-0.001538 |
|
0.00179 |
|
0.001819 |
*** |
|
|
|
|
| T-Statistics |
|
-1.386022 |
|
1.27512 |
|
4.525778 |
|
|
|
|
|
| P-Values |
|
0.1671 |
|
0.2035 |
|
0.0000 |
|
|
|
|
|
| |
|
|
|
|
|
|
|
|
|
|
|
| Coefficient |
Cost Efficiency |
-46.10715 |
*** |
-70.00679 |
*** |
-69.3976 |
*** |
|
|
|
|
| T-Statistics |
|
-4.319749 |
|
-11.49931 |
|
-10.40749 |
|
|
|
|
|
| P-Values |
|
0.0000 |
|
0.0000 |
|
0.0000 |
|
|
|
|
|
| |
|
|
|
|
|
|
|
|
|
|
|
| Coefficient |
Credit Quality |
0.132974 |
* |
0.525914 |
*** |
0.55464 |
*** |
0.208041 |
*** |
0.227217 |
** |
| T-Statistics |
|
1.659269 |
|
2.735755 |
|
3.073517 |
|
4.391417 |
|
2.441165 |
|
| P-Values |
|
0.0984 |
|
0.0067 |
|
0.0024 |
|
0.0000 |
|
0.0154 |
|
| |
|
|
|
|
|
|
|
|
|
|
|
| Coefficient |
Diversification |
5.73E-10 |
|
1.45E-10 |
|
|
|
6.94E-10 |
|
-1.53E-09 |
|
| T-Statistics |
|
0.409704 |
|
0.179957 |
|
|
|
0.628326 |
|
-1.570014 |
|
| P-Values |
|
0.6824 |
|
0.8573 |
|
|
|
0.5304 |
|
0.1177 |
|
| |
|
|
|
|
|
|
|
|
|
|
|
| Coefficient |
Bank Loan Portfolio |
-0.000107 |
|
1.65E-05 |
|
|
|
0.000178 |
|
-0.000554 |
*** |
| T-Statistics |
|
-0.805297 |
|
0.063815 |
|
|
|
1.047966 |
|
-8.20177 |
|
| P-Values |
|
0.4215 |
|
0.9492 |
|
|
|
0.2957 |
|
0.0000 |
|
| |
|
|
|
|
|
|
|
|
|
|
|
| Coefficient |
Non-Performing Loans |
-6.52E-05 |
|
-0.000112 |
** |
-0.000136 |
** |
|
|
|
|
| T-Statistics |
|
-1.151886 |
|
-2.111089 |
|
-2.340998 |
|
|
|
|
|
| P-Values |
|
0.2506 |
|
0.0358 |
|
0.0201 |
|
|
|
|
|
| |
|
|
|
|
|
|
|
|
|
|
|
| Coefficient |
Market Concentration |
-0.00029 |
|
-0.00011 |
|
|
|
|
|
|
|
| T-Statistics |
|
-1.594879 |
|
-0.473904 |
|
|
|
|
|
|
|
| P-Values |
|
0.1121 |
|
0.636 |
|
|
|
|
|
|
|
| |
|
|
|
|
|
|
|
|
|
|
|
| Coefficient |
Inflation |
-8.384053 |
|
0.001042 |
|
|
|
|
|
0.034889 |
|
| T-Statistics |
|
-8.407179 |
|
0.025535 |
|
|
|
|
|
1.13654 |
|
| P-Values |
|
0.0000 |
|
0.9797 |
|
|
|
|
|
0.2569 |
|
| |
|
|
|
|
|
|
|
|
|
|
|
| Coefficient |
Interest Rate |
0.094854 |
|
-0.186681 |
|
-0.221118 |
** |
0.083999 |
** |
0.050837 |
|
| T-Statistics |
|
1.665884 |
|
-1.252933 |
|
-1.968304 |
|
2.207945 |
|
1.14635 |
|
| P-Values |
|
0.0971 |
|
0.2115 |
|
0.0502 |
|
0.0282 |
|
0.2528 |
|
| |
|
|
|
|
|
|
|
|
|
|
|
| Coefficient |
Change in RGDP |
-0.661256 |
|
14.82982 |
* |
15.78036 |
** |
|
|
|
|
| T-Statistics |
|
-0.265494 |
|
1.740556 |
|
2.484227 |
|
|
|
|
|
| P-Values |
|
0.7909 |
|
0.0831 |
|
0.0137 |
|
|
|
|
|
| |
|
|
|
|
|
|
|
|
|
|
|
| Coefficient |
FRASE Current |
-0.951036 |
|
-7.303051 |
* |
-8.005292 |
** |
|
|
|
|
| T-Statistics |
|
-0.746545 |
|
-1.924799 |
|
-2.723464 |
|
|
|
|
|
| P-Values |
|
0.4561 |
|
0.0555 |
|
0.0069 |
|
|
|
|
|
| |
|
|
|
|
|
|
|
|
|
|
|
| Coefficient |
Assets |
1.93E-07 |
|
3.69E-06 |
|
|
|
|
|
|
|
| T-Statistics |
|
0.255622 |
|
1.016637 |
|
|
|
|
|
|
|
| P-Values |
|
0.7985 |
|
0.3104 |
|
|
|
|
|
|
|
| |
|
|
|
|
|
|
|
|
|
|
|
| Coefficient |
NIM |
0.425958 |
|
0.237762 |
** |
0.221161 |
*** |
|
|
|
|
| T-Statistics |
|
2.81375 |
|
2.217571 |
|
2.512385 |
|
|
|
|
|
| P-Values |
|
0.0053 |
|
0.0276 |
|
0.0127 |
|
|
|
|
|
| |
|
|
|
|
|
|
|
|
|
|
|
| |
Wald-test (x2) |
22.04917 |
|
24.87189 |
|
42.53674 |
|
17.33273 |
|
16.62161 |
|
| |
P-value |
0.0000 |
|
0.0000 |
|
0.0000 |
|
0.0000 |
|
0.0000 |
|
| |
Degrees of Freedom |
(15,231) |
|
(14,232) |
|
(9,237) |
|
(6,240) |
|
(5,241) |
|
| |
AB test AR(1) (p-value) |
0.1021 |
|
0.711 |
|
0.0748 |
* |
0.6988 |
|
0.0686 |
* |
| |
AB test AR(2) (p-value) |
0.8278 |
|
0.3571 |
|
0.3628 |
|
0.5684 |
|
0.657 |
|
| Dependent Variable: |
Net Interest Margin |
1 |
|
2 |
|
3 |
|
4 |
|
5 |
|
| |
Regressor |
|
|
|
|
|
|
|
|
|
|
| Coefficient |
Lagged NIM |
-0.135579 |
*** |
|
|
|
|
|
|
|
|
| T-Statistics |
|
-4.419571 |
|
|
|
|
|
|
|
|
|
| P-Values |
|
0 |
|
|
|
|
|
|
|
|
|
| |
|
|
|
|
|
|
|
|
|
|
|
| Coefficient |
Growth of Total Deposits |
0.001211 |
|
0.0072 |
|
|
|
|
|
|
|
| T-Statistics |
|
0.83382 |
|
0.477729 |
|
|
|
|
|
|
|
| P-Values |
|
0.4052 |
|
0.6333 |
|
|
|
|
|
|
|
| |
|
|
|
|
|
|
|
|
|
|
|
| Coefficient |
Interest Income Share |
0.001625 |
|
-0.000485 |
|
-0.000971 |
|
|
|
-0.000753 |
|
| T-Statistics |
|
1.559869 |
|
-0.359968 |
|
-1.450526 |
|
|
|
-0.513956 |
|
| P-Values |
|
0.1202 |
|
0.7192 |
|
0.1482 |
|
|
|
0.6078 |
|
| |
|
|
|
|
|
|
|
|
|
|
|
| Coefficient |
Cost Efficiency |
-5.404967 |
|
1.361259 |
|
|
|
-4.227795 |
|
1.297272 |
|
| T-Statistics |
|
-1.436229 |
|
0.208903 |
|
|
|
-0.555831 |
|
0.257015 |
|
| P-Values |
|
0.1523 |
|
0.8347 |
|
|
|
0.5788 |
|
0.7974 |
|
| |
|
|
|
|
|
|
|
|
|
|
|
| Coefficient |
Credit Quality |
0.065634 |
|
0.058518 |
|
|
|
0.102466 |
|
|
|
| T-Statistics |
|
1.0544747 |
|
0.528938 |
|
|
|
0.811536 |
|
|
|
| P-Values |
|
0.2926 |
|
0.5974 |
|
|
|
0.4179 |
|
|
|
| |
|
|
|
|
|
|
|
|
|
|
|
| Coefficient |
Diversification |
3.29E-10 |
|
-1.85E-10 |
|
|
|
|
|
|
|
| T-Statistics |
|
0.0866369 |
|
-0.321003 |
|
|
|
|
|
|
|
| P-Values |
|
0.3872 |
|
0.7485 |
|
|
|
|
|
|
|
| |
|
|
|
|
|
|
|
|
|
|
|
| Coefficient |
Bank Loan Portfolio |
4.90E-04 |
*** |
-3.36E-05 |
|
|
|
|
|
|
|
| T-Statistics |
|
7.913676 |
|
-0.154244 |
|
|
|
|
|
|
|
| P-Values |
|
0 |
|
0.8776 |
|
|
|
|
|
|
|
| |
|
|
|
|
|
|
|
|
|
|
|
| Coefficient |
Non-Performing Loans |
0.000384 |
*** |
9.80E-05 |
|
0.000149 |
*** |
|
|
0.000162 |
*** |
| T-Statistics |
|
5.845872 |
|
2.611361 |
|
4.224368 |
|
|
|
3.520371 |
|
| P-Values |
|
0 |
|
0.0096 |
|
0.0000 |
|
|
|
0.0005 |
|
| |
|
|
|
|
|
|
|
|
|
|
|
| Coefficient |
Market Concentration |
0.000284 |
|
-0.000379 |
|
-0.000344 |
|
|
|
|
|
| T-Statistics |
|
1.083485 |
|
-1.231675 |
|
-1.49662 |
|
|
|
|
|
| P-Values |
|
0.2797 |
|
0.2193 |
|
0.1358 |
|
|
|
|
|
| |
|
|
|
|
|
|
|
|
|
|
|
| Coefficient |
Inflation |
7.285612 |
** |
-0.050034 |
|
-0.059862 |
** |
-0.05197 |
** |
|
|
| T-Statistics |
|
2.158094 |
|
-1.06382 |
|
-2.426619 |
|
-2.266222 |
|
|
|
| P-Values |
|
0.0319 |
|
0.2885 |
|
0.016 |
|
0.0243 |
|
|
|
| |
|
|
|
|
|
|
|
|
|
|
|
| Coefficient |
Interest Rate |
-0.083257 |
|
-0.162524 |
|
-0.201545 |
*** |
|
|
|
|
| T-Statistics |
|
-0.831332 |
|
-1.009467 |
|
-4.936669 |
|
|
|
|
|
| P-Values |
|
0.4066 |
|
0.3138 |
|
0.0000 |
|
|
|
|
|
| |
|
|
|
|
|
|
|
|
|
|
|
| Coefficient |
Change in RGDP |
-6.836565 |
|
0.137335 |
|
|
|
|
|
|
|
| T-Statistics |
|
-1.357096 |
|
0.016532 |
|
|
|
|
|
|
|
| P-Values |
|
0.1761 |
|
0.9868 |
|
|
|
|
|
|
|
| |
|
|
|
|
|
|
|
|
|
|
|
| Coefficient |
FRASE Current |
0.112943 |
|
1.068448 |
|
|
|
|
|
|
|
| T-Statistics |
|
0.07641 |
|
0.304873 |
|
|
|
|
|
|
|
| P-Values |
|
0.9392 |
|
0.7607 |
|
|
|
|
|
|
|
| |
|
|
|
|
|
|
|
|
|
|
|
| Coefficient |
Assets |
0.00000158 |
*** |
7.83E-07 |
|
-5.80E-05 |
|
2.69E-05 |
|
|
|
| T-Statistics |
|
-4.69457 |
|
0.33901 |
|
-1.425494 |
|
0.58416 |
|
|
|
| P-Values |
|
0 |
|
0.7349 |
|
0.1553 |
|
0.5597 |
|
|
|
| |
|
|
|
|
|
|
|
|
|
|
|
| Coefficient |
Assets2 |
|
|
|
|
1.11E-11 |
|
-3.98E-12 |
|
|
|
| T-Statistics |
|
|
|
|
|
1.420814 |
|
-0.481378 |
|
|
|
| P-Values |
|
|
|
|
|
0.1567 |
|
0.6307 |
|
|
|
| |
|
|
|
|
|
|
|
|
|
|
|
| Coefficient |
Log Assets |
|
|
|
|
2.165943 |
** |
|
|
|
|
| T-Statistics |
|
|
|
|
|
2.466267 |
|
|
|
|
|
| P-Values |
|
|
|
|
|
0.0144 |
|
|
|
|
|
| |
|
|
|
|
|
|
|
|
|
|
|
| Coefficient |
ROA |
|
|
0.138247 |
|
0.144513 |
*** |
|
|
-0.022064 |
|
| T-Statistics |
|
|
|
1.384181 |
|
3.782389 |
|
|
|
-0.267735 |
|
| P-Values |
|
|
|
0.1676 |
|
0.0002 |
|
|
|
0.7891 |
|
| |
|
|
|
|
|
|
|
|
|
|
|
| Coefficient |
ROE |
|
|
-0.001807 |
|
|
|
0.003307 |
|
0.003685 |
|
| T-Statistics |
|
|
|
-0.394199 |
|
|
|
1.189613 |
|
0.853875 |
|
| P-Values |
|
|
|
0.6938 |
|
|
|
0.2354 |
|
0.394 |
|
| |
|
|
|
|
|
|
|
|
|
|
|
| |
Wald-test (x2) |
48.4524 |
|
102.2585 |
|
25.8496 |
|
3.078968 |
|
5.308015 |
|
| |
P-value |
0.0000 |
|
0.0000 |
|
0.000 |
|
0.0064 |
|
0.0001 |
|
| |
Degrees of Freedom |
(14,232) |
|
(15,231) |
|
(9,237) |
|
(6,240) |
|
(5,241) |
|
| |
AB test AR(1) (p-value) |
0.3215 |
|
0.1046 |
|
0.0896 |
|
0.1327 |
|
0.1202 |
|
| |
AB test AR(2) (p-value) |
0.616 |
|
0.104 |
|
0.0616 |
* |
0.1412 |
|
0.1504 |
|
| |
J-statistic |
20.2971 |
|
21.69154 |
|
14.98535 |
|
22.41962 |
|
32.3475 |
|
| |
Prob(J-statistic) |
0.009269 |
|
0.00991 |
|
0.452473 |
|
0.00764 |
|
0.000173 |
|

Al-Ubaydli, O. & McLaughlin, P.A. (2015). RegData: A numerical database on industry-specific regulations for all United States industries and federal regulations, 1997-2012. Regulation & Governance, doi: 10.1111/rego.12107.
Arellano, M. & Bond, S. (1991). Some tests of specification for panel data: Monte Carlo evidence and an application to employment equations. Review of Economic Studies, 58.2, 277–297.
Athanasoglou, P. P., Brissimis, S. N., & Delis, M. D. (2008). Bank-specific, industry-specific and macroeconomic determinants of bank profitability. Journal of International Financial Markets, Institutions and Money, 18.2, 121-136.
Bloomberg L.P. (2015). Data. Retrieved from Bloomberg database.
Blundell, R. & Bond, S. (1998). Initial conditions and moment restrictions in dynamic panel data models. Journal of Econometrics, 87, 115-143.
Board of Governors of the Federal Reserve System (US), 30-Year Conventional Mortgage Rate© [MORTG], retrieved from FRED, Federal Reserve Bank of St. Louis https://research.stlouisfed.org/fred2/series/MORTG, April 25, 2016.
Dietrich, A., & Wanzenried, G., (2011). Determinants of bank profitability before and during the crisis: Evidence from Switzerland. Journal of Financial Markets, Institutions and Money, 21.3, 307-327.
Evans, L. (2012). Impact of the Dodd-Frank Act Depends Largely on Future Rule Making. United States Government Accountability Office, 12. N.p.
Federal Deposit Insurance Corporation. (2015). Deposit Market Share Reports. Retrieved from https://www5.fdic.gov/sod/sodMarketBank.asp?barItem=2
Kanas, A., Vasiliou, D., & Erotis, N. (2012). Revisiting bank profitability: A semi-parametric approach. Journal of International Financial Markets, Institutions and Money, 22.4, 990-1005.
Lux, M., & Greene, R. G. (2015). The State and Fate of Community Banking. Harvard Kennedy School. N.p.
Marsh, T. D., & Norman, J. W. (2012). The Impact of Dodd-Frank on Community Banks. Wake Forest University Legal Studies, Paper No. 2302392.
Naceur, S. B., & Omran, M. (2011). The Effects of Bank Regulations, Competition, And Financial Reforms on Banks' Performance. Emerging Markets Review, 12.1, 1-20.
Ozkan, S., Balsari, C. K., & Varan, S. (2014). Effect of Banking Regulation On Performance: Evidence from Turkey. Emerging Markets Finance & Trade, 50.4, 196-211.
Pierce, H., Robinson, I., & Stratmann, T. (2014). How Are Small Banks Faring Under Dodd-Frank?" George Mason University, N.p.
Pierce, H., & Miller, S. M. (2015). Small Banks by the Numbers. Mercatus Center, 2000–2014. N.p.
US. Bureau of Labor Statistics. Consumer Price Index for All Urban Consumers: All Items [CPIAUCSL], retrieved from FRED, Federal Reserve Bank of St. Louis. https://research.stlouisfed.org/fred2/series/CPIAUCSL, April 25, 2016.
US. Bureau of Economic Analysis. Real Gross Domestic Product [A191RL1Q225SBEA], retrieved from FRED, Federal Reserve Bank of St. Louis. https://research.stlouisfed.org/fred2/series/A191RL1Q225SBEA, April 25, 2016.
Appendix A: Banks & Locations Data
| Bank Code |
Bank Name |
State |
Community Bank |
| 1 |
Peoples United Bank |
CT |
No |
| 2 |
Webster Bank |
CT |
No |
| 3 |
PB Bancorp, Inc |
CT |
Yes |
| 4 |
Salisbury Bancorp, Inc. |
CT |
Yes |
| 5 |
SI Financial Group, Inc. |
CT |
Yes |
| 6 |
United Financial Bancorp, Inc. |
CT |
Yes |
| 7 |
Boston Private Financial Holdings, Inc. |
MA |
Yes |
| 8 |
Bershire Hills Bancorp, Inc. |
MA |
Yes |
| 9 |
Brookline Bancorp, Inc. |
MA |
Yes |
| 10 |
Chicopee Bancorp, Inc. |
MA |
Yes |
| 11 |
Century Bancorp, Inc. |
MA |
Yes |
| 12 |
Meridian Bancorp, Inc. |
MA |
Yes |
| 13 |
Enterprise Bank and Trust Company |
MA |
Yes |
| 14 |
Independent Bank Corp/MA |
MA |
Yes |
| 15 |
Westfield Finanacial, Inc |
MA |
Yes |
| 16 |
Bar Harbor Bank & Trust |
ME |
Yes |
| 17 |
Camden National Corporation |
ME |
Yes |
| 18 |
First Bancorp, Inc. |
ME |
Yes |
| 19 |
Northeast Bancorp |
ME |
Yes |
| 20 |
Lake Sunapee Bank Group |
NH |
Yes |
| 21 |
Hudson City Bancorp |
NJ |
No |
| 22 |
Valley National Bancorp |
NJ |
No |
| 23 |
BCB Bancorp Inc |
NJ |
Yes |
| 24 |
First Constitution Bancorp |
NJ |
Yes |
| 25 |
Cape Bancorp, Inc. |
NJ |
Yes |
| 26 |
ConnectOne Bancorp |
NJ |
Yes |
| 27 |
Lakeland Bancorp |
NJ |
Yes |
| 28 |
Maguyar Bancorp, Inc |
NJ |
Yes |
| 29 |
Northfield Bancorp, Inc. |
NJ |
Yes |
| 30 |
OceanFirst Financial Corp. |
NJ |
Yes |
| 31 |
Oritani Financial Corp |
NJ |
Yes |
| 32 |
Ocean Shore Holding Co. |
NJ |
Yes |
| 33 |
Providnet Financial Services, Inc |
NJ |
Yes |
| 34 |
Peapack-Gladstone Financial |
NJ |
Yes |
| 35 |
Parke Bancorp |
NJ |
Yes |
| 36 |
Sussex Bancorp |
NJ |
Yes |
| 37 |
Stewardship Financial Corporation |
NJ |
Yes |
| 38 |
Two River Bancorp |
NJ |
Yes |
| 39 |
Unity Bancorp, Inc |
NJ |
Yes |
| 40 |
Bank of NY Mellon |
NY |
No |
| 41 |
Citigroup |
NY |
No |
| 42 |
First Niagara Financial Group Inc. |
NY |
No |
| 43 |
M&T Bank Corp |
NY |
No |
| 44 |
New York Community Bancorp, Inc |
NY |
No |
| 45 |
JPMorgan Chase & Co |
NY |
No |
| 46 |
Signature Bank |
NY |
No |
| 47 |
The Bridgehampton National Bank |
NY |
Yes |
| 48 |
Financial Institutions |
NY |
Yes |
| 49 |
TrustCo Bank Corp |
NY |
Yes |
| 50 |
Arrow Financial Corp |
NY |
Yes |
| 51 |
Chemung Financial Corp |
NY |
Yes |
| 52 |
First of Long Island Corp |
NY |
Yes |
| 53 |
Flusing Financial Corp |
NY |
Yes |
| 54 |
Suffolk Bancorp |
NY |
Yes |
| 55 |
Tompkins Financial Corp |
NY |
Yes |
| 56 |
FNB Corp |
PA |
No |
| 57 |
Fulton Financial Corp |
PA |
No |
| 58 |
PNC Financial Services Group |
PA |
No |
| 59 |
Bryn Mawr Bank Corp |
PA |
Yes |
| 60 |
First Commonwealth Financial Corp |
PA |
Yes |
| 61 |
Orrstown Financial Services, Inc |
PA |
Yes |
| 62 |
S&T Bancorp Inc |
PA |
Yes |
| 63 |
Univest Corp of Pennsylvania |
PA |
Yes |
| 64 |
ACNB Bank |
PA |
Yes |
| 65 |
AmeriServ Financial Inc. |
PA |
Yes |
| 66 |
Beneficial Bancorp Inc |
PA |
Yes |
| 67 |
CNB Financial Corp |
PA |
Yes |
| 68 |
Codorus Valley Bancorp |
PA |
Yes |
| 69 |
First Citizens Community Bank |
PA |
Yes |
| 70 |
DNB First, National Association |
PA |
Yes |
| 71 |
The Fidelity Deposit and Discount Bank |
PA |
Yes |
| 72 |
First Keystone Community Bank |
PA |
Yes |
| 73 |
Republic First Bancorp, Inc |
PA |
Yes |
| 74 |
Fox Chase Bancorp, Inc. |
PA |
Yes |
| 75 |
Mid Penn Bank |
PA |
Yes |
| 76 |
National Penn Bancshares |
PA |
Yes |
| 77 |
Northwest Bancshares |
PA |
Yes |
| 78 |
Norwood Fianncial Corp |
PA |
Yes |
| 79 |
Prudential Bancorp |
PA |
Yes |
| 80 |
Penns Wood Bancorp |
PA |
Yes |
| 81 |
QNB Bank |
PA |
Yes |
| 82 |
Royal Bancshares of Pennsylvania, Inc |
PA |
Yes |
Appendix B: Correlation Matrix Appendix C Variable Descriptions
| Variable |
Measure |
Notation |
Expected Effect |
| Return on Equity |
Net income / average common equity |
ROE |
|
| Return on Assets |
Net income / average assets |
ROA |
|
| Net Interest Margin |
Net interest income / earnings assets |
NIM |
|
| Bank Code |
Corresponding code with each bank's name |
BCode |
? |
| Time Code |
Corresponding code with each time period |
TCode |
? |
| Community Bank Status |
<10 billion in assets is considered a community bank |
BankStatus |
- |
| Total Deposit Growth |
The percentage change over a one year period of total deposits |
TotDepG |
? |
| Interest Income Share |
The percentage of interest based income divided by non-interest income |
IntIncShare |
? |
| Cost Efficiency |
Total operating expenses / total revenue + total deposits |
CostEff |
- |
| Credit Quality |
Reserve for loan loss / total loans |
CreditQual |
+ |
| Diversification |
(Non-interest income / gross income)^2 / (interest income / gross income)^2 |
Div |
? |
| Bank Portfolio |
Total consumer loans / total commercial loans |
BankPort |
? |
| Non-performing loans |
Sequential growth from year before of loans in default (that do not accrue interest) |
NonPerG |
- |
| Herfindahl-Hirschman Index |
The market shares of each state that the bank are headquartered |
HHI |
? |
| Consumer Price Index |
The percentage change of the CPI lagged one period for all urban consumers in the Northeast |
CPI |
+ |
| Interest Rate |
The percentage change of the 30 year annual interest rate lagged one year |
IntRate |
+ |
| Real Gross Domestic Product |
The percentage change of RGDP each year |
RGDP |
+ |
| Assets |
The bank’s total assets for each year |
ASSETS |
? |
| Log Assets |
The bank’s total assets for each year logged |
LOGASSETS |
? |
| FRASE Current Index |
Ratio of the impact of federal regulations on a specific state’s industry to impact of regulation on the nation |
FRASECUR |
- |
Appendix D: Descriptive Statistics
| |
Mean |
Median |
Maximum |
Minimum |
Std. Dev. |
|
| ROA |
0.71 |
0.79 |
2.46 |
-2.87 |
0.54 |
|
| ROE |
6.73 |
7.78 |
26.65 |
-52.44 |
6.81 |
|
| NIM |
3.46 |
3.47 |
6.66 |
1.19 |
0.59 |
|
| CREDITQUAL |
1.45 |
1.32 |
5.98 |
0.00 |
0.66 |
|
| DIV |
2,692,880 |
0.45 |
157,000,000 |
0.00 |
17,352,034 |
|
| BANKPORT |
8.44 |
0.58 |
930.96 |
0.01 |
72.48 |
|
| INTINCSHARE |
6.73 |
4.78 |
163.95 |
-85.37 |
14.32 |
|
| TOTDEPG |
7.59 |
4.97 |
132.46 |
-23.53 |
13.89 |
|
| COSTEFF |
0.01 |
0.01 |
0.03 |
0.00 |
0.00 |
|
| NPLG |
5.78 |
-3.25 |
1871.20 |
-68.95 |
101.93 |
|
| HHI |
970.58 |
769.77 |
1740.00 |
476.11 |
343.48 |
|
| RGDP |
0.02 |
0.02 |
0.03 |
0.01 |
0.01 |
|
| CPI |
0.33 |
0.02 |
1.59 |
-0.13 |
0.63 |
|
| INTRATE |
-0.03 |
-0.13 |
0.33 |
-0.16 |
0.19 |
|
| ASSETS |
64979.82 |
1805.369 |
2572274 |
445.578 |
330234 |
| LOGASSETS |
3.481498 |
3.256504 |
6.410317 |
2.648924 |
0.758645 |
| FRASECUR |
1.18414 |
1.196959 |
1.291662 |
0.892552 |
0.07188 |
Appendix E: ROE Dependent Variable: Model Results
| Dependent Variable: |
Return on Equity |
1 |
|
2 |
|
3 |
|
4 |
|
5 |
|
| |
Regressor |
|
|
|
|
|
|
|
|
|
|
| Coefficient |
Lagged ROE |
-0.222379 |
*** |
|
|
|
|
|
|
|
|
| T-Statistics |
|
-4.641318 |
|
|
|
|
|
|
|
|
|
| P-Values |
|
0.0000 |
|
|
|
|
|
|
|
|
|
| |
|
|
|
|
|
|
|
|
|
|
|
| Coefficient |
Growth of Total Deposits |
0.042634 |
*** |
0.017546 |
|
-0.088893 |
*** |
|
|
-0.024719 |
*** |
| T-Statistics |
|
3.120637 |
|
-1.530967 |
|
-2.684342 |
|
|
|
-2.789861 |
|
| P-Values |
|
0.0019 |
|
0.1271 |
|
0.0078 |
|
|
|
0.0057 |
|
| |
|
|
|
|
|
|
|
|
|
|
|
| Coefficient |
Interest Income Share |
0.002709 |
|
0.014365 |
|
|
|
|
|
0.053697 |
* |
| T-Statistics |
|
0.2229633 |
|
1.150026 |
|
|
|
|
|
1.853102 |
|
| P-Values |
|
0.8186 |
|
0.2513 |
|
|
|
|
|
0.0651 |
|
| |
|
|
|
|
|
|
|
|
|
|
|
| Coefficient |
Cost Efficiency |
-204.8525 |
|
-765.8297 |
*** |
|
|
|
|
-722.0357 |
*** |
| T-Statistics |
|
-1.184075 |
|
-7.28034 |
|
|
|
|
|
-4.593356 |
|
| P-Values |
|
0.2376 |
|
0 |
|
|
|
|
|
0.0000 |
|
| |
|
|
|
|
|
|
|
|
|
|
|
| Coefficient |
Credit Quality |
0.744468 |
|
4.740938 |
*** |
1.773751 |
|
2.127958 |
* |
|
|
| T-Statistics |
|
0.953958 |
|
2.654656 |
|
1.473657 |
|
1.914029 |
|
|
|
| P-Values |
|
0.3411 |
|
0.0085 |
|
0.1419 |
|
0.0568 |
|
|
|
| |
|
|
|
|
|
|
|
|
|
|
|
| Coefficient |
Diversification |
4.51E-09 |
|
3.23E-09 |
|
|
|
|
|
|
|
| T-Statistics |
|
0.209837 |
|
0.501367 |
|
|
|
|
|
|
|
| P-Values |
|
0.834 |
|
0.6166 |
|
|
|
|
|
|
|
| |
|
|
|
|
|
|
|
|
|
|
|
| Coefficient |
Bank Loan Portfolio |
0.004794 |
** |
0.000723 |
|
-0.007029 |
*** |
-0.005287 |
*** |
|
|
| T-Statistics |
|
2.214442 |
|
0.159839 |
|
-5.887582 |
|
-11.84652 |
|
|
|
| P-Values |
|
0.0278 |
|
0.8731 |
|
0.0000 |
|
0.0000 |
|
|
|
| |
|
|
|
|
|
|
|
|
|
|
|
| Coefficient |
Non-Performing Loans |
0.001342 |
*** |
-0.001771 |
* |
-0.002343 |
** |
|
|
|
|
| T-Statistics |
|
5.487847 |
|
-1.861327 |
|
-2.081315 |
|
|
|
|
|
| P-Values |
|
0.0000 |
|
0.064 |
|
0.0385 |
|
|
|
|
|
| |
|
|
|
|
|
|
|
|
|
|
|
| Coefficient |
Market Concentration |
-0.003152 |
** |
0.000648 |
|
-0.002475 |
|
0.000163 |
|
|
|
| T-Statistics |
|
-2.410379 |
|
0.297074 |
|
-0.792956 |
|
0.089649 |
|
|
|
| P-Values |
|
0.0167 |
|
0.7667 |
|
0.4286 |
|
0.9286 |
|
|
|
| |
|
|
|
|
|
|
|
|
|
|
|
| Coefficient |
Inflation |
-218.384 |
*** |
-0.114589 |
|
|
|
|
|
|
|
| T-Statistics |
|
-16.29475 |
|
-0.25318 |
|
|
|
|
|
|
|
| P-Values |
|
0.0000 |
|
0.8004 |
|
|
|
|
|
|
|
| |
|
|
|
|
|
|
|
|
|
|
|
| Coefficient |
Interest Rate |
1.152717 |
** |
-2.984662 |
** |
|
|
0.914768 |
** |
|
|
| T-Statistics |
|
2.037336 |
|
-2.318289 |
|
|
|
1.966565 |
|
|
|
| P-Values |
|
0.0428 |
|
0.0213 |
|
|
|
0.0504 |
|
|
|
| |
|
|
|
|
|
|
|
|
|
|
|
| Coefficient |
Change in RGDP |
2.917723 |
*** |
194.0825 |
*** |
|
|
|
|
|
|
| T-Statistics |
|
0.085212 |
|
2.560604 |
|
|
|
|
|
|
|
| P-Values |
|
0.9322 |
|
0.0111 |
|
|
|
|
|
|
|
| |
|
|
|
|
|
|
|
|
|
|
|
| Coefficient |
FRASE Current |
26.20471 |
* |
-84.99074 |
*** |
-15.12968 |
|
|
|
|
|
| T-Statistics |
|
1.694851 |
|
-2.399252 |
|
-0.870833 |
|
|
|
|
|
| P-Values |
|
0.0914 |
|
0.0172 |
|
0.3847 |
|
|
|
|
|
| |
|
|
|
|
|
|
|
|
|
|
|
| Coefficient |
Assets |
|
|
0.0000425 |
|
0.001809 |
*** |
|
|
|
|
| T-Statistics |
|
|
|
0.826166 |
|
2.901016 |
|
|
|
|
|
| P-Values |
|
|
|
0.4096 |
|
0.0041 |
|
|
|
|
|
| |
|
|
|
|
|
|
|
|
|
|
|
| Coefficient |
Log Assets |
-42.43464 |
*** |
|
|
|
|
|
|
|
|
| T-Statistics |
|
-6.355648 |
|
|
|
|
|
|
|
|
|
| P-Values |
|
0.0000 |
|
|
|
|
|
|
|
|
|
| |
|
|
|
|
|
|
|
|
|
|
|
| |
Wald-test (x2) |
154.92 |
|
13.57753 |
|
74.94697 |
|
70.59398 |
|
17.1347 |
|
| |
P-value |
0.0000 |
|
0.0000 |
|
0.0000 |
|
0.0000 |
|
0.0000 |
|
| |
Degrees of Freedom |
(14,232) |
|
(13,233) |
|
(7,239) |
|
(4,242) |
|
(3,243) |
|
| |
AB test AR(1) (p-value) |
0.2542 |
|
0.1213 |
|
0.0002 |
*** |
0.1128 |
|
0.1131 |
|
| |
AB test AR(2) (p-value) |
0.9036 |
|
0.2354 |
|
0.376 |
|
0.2852 |
|
0.2576 |
|
| |
J-statistic |
28.63165 |
|
13.27295 |
|
19.95601 |
|
16.9328 |
|
13.44474 |
|
Appendix F: ROA Dependent Variable: Model Results
| Dependent Variable: |
Return on Assets |
1 |
|
2 |
|
3 |
|
4 |
|
5 |
|
| |
Regressor |
|
|
|
|
|
|
|
|
|
|
| Coefficient |
Lagged ROA |
-0.11401 |
*** |
|
|
|
|
-0.163621 |
|
|
|
| T-Statistics |
|
-3.330133 |
|
|
|
|
|
-5.606098 |
|
|
|
| P-Values |
|
0.001 |
|
|
|
|
|
0.0000 |
*** |
|
|
| |
|
|
|
|
|
|
|
|
|
|
|
| Coefficient |
Growth of Total Deposits |
-0.003856 |
*** |
-0.001541 |
|
-0.001688 |
** |
|
|
|
|
| T-Statistics |
|
-6.394816 |
|
-1.519691 |
|
-1.96318 |
|
|
|
|
|
| P-Values |
|
0.000 |
|
0.1300 |
|
0.0508 |
|
|
|
|
|
| |
|
|
|
|
|
|
|
|
|
|
|
| Coefficient |
Interest Income Share |
-0.001538 |
|
0.00179 |
|
0.001819 |
*** |
|
|
|
|
| T-Statistics |
|
-1.386022 |
|
1.27512 |
|
4.525778 |
|
|
|
|
|
| P-Values |
|
0.1671 |
|
0.2035 |
|
0.0000 |
|
|
|
|
|
| |
|
|
|
|
|
|
|
|
|
|
|
| Coefficient |
Cost Efficiency |
-46.10715 |
*** |
-70.00679 |
*** |
-69.3976 |
*** |
|
|
|
|
| T-Statistics |
|
-4.319749 |
|
-11.49931 |
|
-10.40749 |
|
|
|
|
|
| P-Values |
|
0.0000 |
|
0.0000 |
|
0.0000 |
|
|
|
|
|
| |
|
|
|
|
|
|
|
|
|
|
|
| Coefficient |
Credit Quality |
0.132974 |
* |
0.525914 |
*** |
0.55464 |
*** |
0.208041 |
*** |
0.227217 |
** |
| T-Statistics |
|
1.659269 |
|
2.735755 |
|
3.073517 |
|
4.391417 |
|
2.441165 |
|
| P-Values |
|
0.0984 |
|
0.0067 |
|
0.0024 |
|
0.0000 |
|
0.0154 |
|
| |
|
|
|
|
|
|
|
|
|
|
|
| Coefficient |
Diversification |
5.73E-10 |
|
1.45E-10 |
|
|
|
6.94E-10 |
|
-1.53E-09 |
|
| T-Statistics |
|
0.409704 |
|
0.179957 |
|
|
|
0.628326 |
|
-1.570014 |
|
| P-Values |
|
0.6824 |
|
0.8573 |
|
|
|
0.5304 |
|
0.1177 |
|
| |
|
|
|
|
|
|
|
|
|
|
|
| Coefficient |
Bank Loan Portfolio |
-0.000107 |
|
1.65E-05 |
|
|
|
0.000178 |
|
-0.000554 |
*** |
| T-Statistics |
|
-0.805297 |
|
0.063815 |
|
|
|
1.047966 |
|
-8.20177 |
|
| P-Values |
|
0.4215 |
|
0.9492 |
|
|
|
0.2957 |
|
0.0000 |
|
| |
|
|
|
|
|
|
|
|
|
|
|
| Coefficient |
Non-Performing Loans |
-6.52E-05 |
|
-0.000112 |
** |
-0.000136 |
** |
|
|
|
|
| T-Statistics |
|
-1.151886 |
|
-2.111089 |
|
-2.340998 |
|
|
|
|
|
| P-Values |
|
0.2506 |
|
0.0358 |
|
0.0201 |
|
|
|
|
|
| |
|
|
|
|
|
|
|
|
|
|
|
| Coefficient |
Market Concentration |
-0.00029 |
|
-0.00011 |
|
|
|
|
|
|
|
| T-Statistics |
|
-1.594879 |
|
-0.473904 |
|
|
|
|
|
|
|
| P-Values |
|
0.1121 |
|
0.636 |
|
|
|
|
|
|
|
| |
|
|
|
|
|
|
|
|
|
|
|
| Coefficient |
Inflation |
-8.384053 |
|
0.001042 |
|
|
|
|
|
0.034889 |
|
| T-Statistics |
|
-8.407179 |
|
0.025535 |
|
|
|
|
|
1.13654 |
|
| P-Values |
|
0.0000 |
|
0.9797 |
|
|
|
|
|
0.2569 |
|
| |
|
|
|
|
|
|
|
|
|
|
|
| Coefficient |
Interest Rate |
0.094854 |
|
-0.186681 |
|
-0.221118 |
** |
0.083999 |
** |
0.050837 |
|
| T-Statistics |
|
1.665884 |
|
-1.252933 |
|
-1.968304 |
|
2.207945 |
|
1.14635 |
|
| P-Values |
|
0.0971 |
|
0.2115 |
|
0.0502 |
|
0.0282 |
|
0.2528 |
|
| |
|
|
|
|
|
|
|
|
|
|
|
| Coefficient |
Change in RGDP |
-0.661256 |
|
14.82982 |
* |
15.78036 |
** |
|
|
|
|
| T-Statistics |
|
-0.265494 |
|
1.740556 |
|
2.484227 |
|
|
|
|
|
| P-Values |
|
0.7909 |
|
0.0831 |
|
0.0137 |
|
|
|
|
|
| |
|
|
|
|
|
|
|
|
|
|
|
| Coefficient |
FRASE Current |
-0.951036 |
|
-7.303051 |
* |
-8.005292 |
** |
|
|
|
|
| T-Statistics |
|
-0.746545 |
|
-1.924799 |
|
-2.723464 |
|
|
|
|
|
| P-Values |
|
0.4561 |
|
0.0555 |
|
0.0069 |
|
|
|
|
|
| |
|
|
|
|
|
|
|
|
|
|
|
| Coefficient |
Assets |
1.93E-07 |
|
3.69E-06 |
|
|
|
|
|
|
|
| T-Statistics |
|
0.255622 |
|
1.016637 |
|
|
|
|
|
|
|
| P-Values |
|
0.7985 |
|
0.3104 |
|
|
|
|
|
|
|
| |
|
|
|
|
|
|
|
|
|
|
|
| Coefficient |
NIM |
0.425958 |
|
0.237762 |
** |
0.221161 |
*** |
|
|
|
|
| T-Statistics |
|
2.81375 |
|
2.217571 |
|
2.512385 |
|
|
|
|
|
| P-Values |
|
0.0053 |
|
0.0276 |
|
0.0127 |
|
|
|
|
|
| |
|
|
|
|
|
|
|
|
|
|
|
| |
Wald-test (x2) |
22.04917 |
|
24.87189 |
|
42.53674 |
|
17.33273 |
|
16.62161 |
|
| |
P-value |
0.0000 |
|
0.0000 |
|
0.0000 |
|
0.0000 |
|
0.0000 |
|
| |
Degrees of Freedom |
(15,231) |
|
(14,232) |
|
(9,237) |
|
(6,240) |
|
(5,241) |
|
| |
AB test AR(1) (p-value) |
0.1021 |
|
0.711 |
|
0.0748 |
* |
0.6988 |
|
0.0686 |
* |
| |
AB test AR(2) (p-value) |
0.8278 |
|
0.3571 |
|
0.3628 |
|
0.5684 |
|
0.657 |
|
Appendix G: NIM Dependent Variable: Model Results
| Dependent Variable: |
Net Interest Margin |
1 |
|
2 |
|
3 |
|
4 |
|
5 |
|
| |
Regressor |
|
|
|
|
|
|
|
|
|
|
| Coefficient |
Lagged NIM |
-0.135579 |
*** |
|
|
|
|
|
|
|
|
| T-Statistics |
|
-4.419571 |
|
|
|
|
|
|
|
|
|
| P-Values |
|
0 |
|
|
|
|
|
|
|
|
|
| |
|
|
|
|
|
|
|
|
|
|
|
| Coefficient |
Growth of Total Deposits |
0.001211 |
|
0.0072 |
|
|
|
|
|
|
|
| T-Statistics |
|
0.83382 |
|
0.477729 |
|
|
|
|
|
|
|
| P-Values |
|
0.4052 |
|
0.6333 |
|
|
|
|
|
|
|
| |
|
|
|
|
|
|
|
|
|
|
|
| Coefficient |
Interest Income Share |
0.001625 |
|
-0.000485 |
|
-0.000971 |
|
|
|
-0.000753 |
|
| T-Statistics |
|
1.559869 |
|
-0.359968 |
|
-1.450526 |
|
|
|
-0.513956 |
|
| P-Values |
|
0.1202 |
|
0.7192 |
|
0.1482 |
|
|
|
0.6078 |
|
| |
|
|
|
|
|
|
|
|
|
|
|
| Coefficient |
Cost Efficiency |
-5.404967 |
|
1.361259 |
|
|
|
-4.227795 |
|
1.297272 |
|
| T-Statistics |
|
-1.436229 |
|
0.208903 |
|
|
|
-0.555831 |
|
0.257015 |
|
| P-Values |
|
0.1523 |
|
0.8347 |
|
|
|
0.5788 |
|
0.7974 |
|
| |
|
|
|
|
|
|
|
|
|
|
|
| Coefficient |
Credit Quality |
0.065634 |
|
0.058518 |
|
|
|
0.102466 |
|
|
|
| T-Statistics |
|
1.0544747 |
|
0.528938 |
|
|
|
0.811536 |
|
|
|
| P-Values |
|
0.2926 |
|
0.5974 |
|
|
|
0.4179 |
|
|
|
| |
|
|
|
|
|
|
|
|
|
|
|
| Coefficient |
Diversification |
3.29E-10 |
|
-1.85E-10 |
|
|
|
|
|
|
|
| T-Statistics |
|
0.0866369 |
|
-0.321003 |
|
|
|
|
|
|
|
| P-Values |
|
0.3872 |
|
0.7485 |
|
|
|
|
|
|
|
| |
|
|
|
|
|
|
|
|
|
|
|
| Coefficient |
Bank Loan Portfolio |
4.90E-04 |
*** |
-3.36E-05 |
|
|
|
|
|
|
|
| T-Statistics |
|
7.913676 |
|
-0.154244 |
|
|
|
|
|
|
|
| P-Values |
|
0 |
|
0.8776 |
|
|
|
|
|
|
|
| |
|
|
|
|
|
|
|
|
|
|
|
| Coefficient |
Non-Performing Loans |
0.000384 |
*** |
9.80E-05 |
|
0.000149 |
*** |
|
|
0.000162 |
*** |
| T-Statistics |
|
5.845872 |
|
2.611361 |
|
4.224368 |
|
|
|
3.520371 |
|
| P-Values |
|
0 |
|
0.0096 |
|
0.0000 |
|
|
|
0.0005 |
|
| |
|
|
|
|
|
|
|
|
|
|
|
| Coefficient |
Market Concentration |
0.000284 |
|
-0.000379 |
|
-0.000344 |
|
|
|
|
|
| T-Statistics |
|
1.083485 |
|
-1.231675 |
|
-1.49662 |
|
|
|
|
|
| P-Values |
|
0.2797 |
|
0.2193 |
|
0.1358 |
|
|
|
|
|
| |
|
|
|
|
|
|
|
|
|
|
|
| Coefficient |
Inflation |
7.285612 |
** |
-0.050034 |
|
-0.059862 |
** |
-0.05197 |
** |
|
|
| T-Statistics |
|
2.158094 |
|
-1.06382 |
|
-2.426619 |
|
-2.266222 |
|
|
|
| P-Values |
|
0.0319 |
|
0.2885 |
|
0.016 |
|
0.0243 |
|
|
|
| |
|
|
|
|
|
|
|
|
|
|
|
| Coefficient |
Interest Rate |
-0.083257 |
|
-0.162524 |
|
-0.201545 |
*** |
|
|
|
|
| T-Statistics |
|
-0.831332 |
|
-1.009467 |
|
-4.936669 |
|
|
|
|
|
| P-Values |
|
0.4066 |
|
0.3138 |
|
0.0000 |
|
|
|
|
|
| |
|
|
|
|
|
|
|
|
|
|
|
| Coefficient |
Change in RGDP |
-6.836565 |
|
0.137335 |
|
|
|
|
|
|
|
| T-Statistics |
|
-1.357096 |
|
0.016532 |
|
|
|
|
|
|
|
| P-Values |
|
0.1761 |
|
0.9868 |
|
|
|
|
|
|
|
| |
|
|
|
|
|
|
|
|
|
|
|
| Coefficient |
FRASE Current |
0.112943 |
|
1.068448 |
|
|
|
|
|
|
|
| T-Statistics |
|
0.07641 |
|
0.304873 |
|
|
|
|
|
|
|
| P-Values |
|
0.9392 |
|
0.7607 |
|
|
|
|
|
|
|
| |
|
|
|
|
|
|
|
|
|
|
|
| Coefficient |
Assets |
0.00000158 |
*** |
7.83E-07 |
|
-5.80E-05 |
|
2.69E-05 |
|
|
|
| T-Statistics |
|
-4.69457 |
|
0.33901 |
|
-1.425494 |
|
0.58416 |
|
|
|
| P-Values |
|
0 |
|
0.7349 |
|
0.1553 |
|
0.5597 |
|
|
|
| |
|
|
|
|
|
|
|
|
|
|
|
| Coefficient |
Assets2 |
|
|
|
|
1.11E-11 |
|
-3.98E-12 |
|
|
|
| T-Statistics |
|
|
|
|
|
1.420814 |
|
-0.481378 |
|
|
|
| P-Values |
|
|
|
|
|
0.1567 |
|
0.6307 |
|
|
|
| |
|
|
|
|
|
|
|
|
|
|
|
| Coefficient |
Log Assets |
|
|
|
|
2.165943 |
** |
|
|
|
|
| T-Statistics |
|
|
|
|
|
2.466267 |
|
|
|
|
|
| P-Values |
|
|
|
|
|
0.0144 |
|
|
|
|
|
| |
|
|
|
|
|
|
|
|
|
|
|
| Coefficient |
ROA |
|
|
0.138247 |
|
0.144513 |
*** |
|
|
-0.022064 |
|
| T-Statistics |
|
|
|
1.384181 |
|
3.782389 |
|
|
|
-0.267735 |
|
| P-Values |
|
|
|
0.1676 |
|
0.0002 |
|
|
|
0.7891 |
|
| |
|
|
|
|
|
|
|
|
|
|
|
| Coefficient |
ROE |
|
|
-0.001807 |
|
|
|
0.003307 |
|
0.003685 |
|
| T-Statistics |
|
|
|
-0.394199 |
|
|
|
1.189613 |
|
0.853875 |
|
| P-Values |
|
|
|
0.6938 |
|
|
|
0.2354 |
|
0.394 |
|
| |
|
|
|
|
|
|
|
|
|
|
|
| |
Wald-test (x2) |
48.4524 |
|
102.2585 |
|
25.8496 |
|
3.078968 |
|
5.308015 |
|
| |
P-value |
0.0000 |
|
0.0000 |
|
0.000 |
|
0.0064 |
|
0.0001 |
|
| |
Degrees of Freedom |
(14,232) |
|
(15,231) |
|
(9,237) |
|
(6,240) |
|
(5,241) |
|
| |
AB test AR(1) (p-value) |
0.3215 |
|
0.1046 |
|
0.0896 |
|
0.1327 |
|
0.1202 |
|
| |
AB test AR(2) (p-value) |
0.616 |
|
0.104 |
|
0.0616 |
* |
0.1412 |
|
0.1504 |
|
| |
J-statistic |
20.2971 |
|
21.69154 |
|
14.98535 |
|
22.41962 |
|
32.3475 |
|
| |
Prob(J-statistic) |
0.009269 |
|
0.00991 |
|
0.452473 |
|
0.00764 |
|
0.000173 |
|
Appendix H: FRASE Score Map
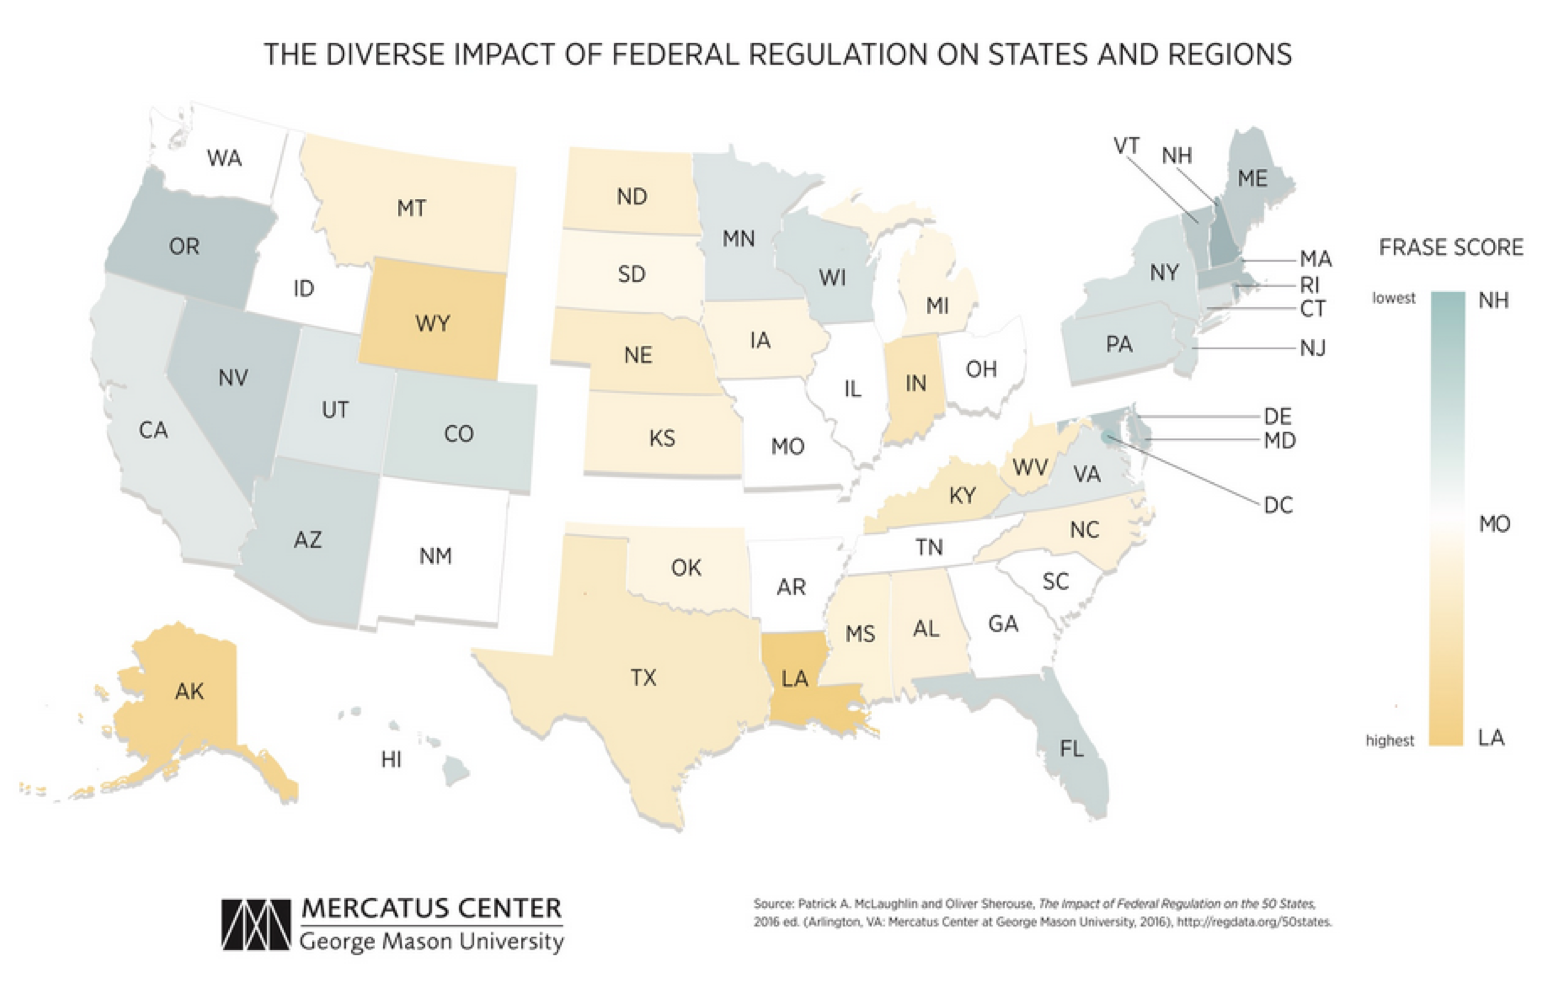
Suggested Reading from Inquiries Journal
A number of reports have established a diagnosis of the financial crisis. The first was produced by the Financial Stability Forum, in April 2008 and was the basis for the preparation of the first G 20 meetings in 2008. The International Monetary Fund (IMF) and the G 30 produced updated analysis in 2008 and 2009. More recently, the... MORE»
Newspaper and Television commentaries in the United States and Europe abound with references to "outbursts of populism" in United States as a stereotypically American response to economic crisis.1 Their story lines trivialize historic Populism in the U.S., both its substance and its contribution to financial regulation. American... MORE»
The global economy is currently experiencing the “most severe financial crisis since the Great Depression.” The ongoing crisis has battered global financial markets and has triggered a world-wide recession. Global stock market values declined by $35 trillion during 2008 and early 2009, and global economic output is expected... MORE»
September 15th, 2008. Lehman Brothers files for bankruptcy. The Anglo- American model of finance collapses. This is a “Big Bang” for the global financial markets. The months following saw a rush to rebuild the premises of the financial markets and set the stage for a regulatory revolution. The G-20 meetings have offered... MORE»
Latest in Economics
2020, Vol. 12 No. 09
Recent work with the Economic Complexity Index (ECI) has shown that a country’s productive structure constrains its level of economic growth and income inequality. Building on previous research that identified an increasing gap between Latin... Read Article »
2018, Vol. 10 No. 10
The value proposition in the commercial setting is the functional relationship of quality and price. It is held to be a utility maximizing function of the relationship between buyer and seller. Its proponents assert that translation of the value... Read Article »
2018, Vol. 10 No. 03
Devastated by an economic collapse at the end of the 20th century, Japan’s economy entered a decade long period of stagnation. Now, Japan has found stable leadership, but attempts at new economic growth have fallen through. A combination of... Read Article »
2014, Vol. 6 No. 10
In July 2012, Spain's unemployment rate was above 20%, its stock market was at its lowest point in a decade, and the government was borrowing at a rate of 7.6%. With domestic demand depleted and no sign of recovery in sight, President Mariano Rajoy... Read Article »
2017, Vol. 9 No. 10
During the periods of the Agrarian Revolt and the 1920s, farmers were unhappy with the economic conditions in which they found themselves. Both periods witnessed the ascent of political movements that endeavored to aid farmers in their economic... Read Article »
2017, Vol. 7 No. 2
In 2009, Brazil was in the path to become a superpower. Immune to the economic crises of 2008, the country's economy benefitted from the commodity boom, achieving a growth rate of 7.5 per cent in 2010, when Rousseff was elected. A few years later... Read Article »
2012, Vol. 2 No. 1
The research completed aimed to show that the idea of fair trade, using the example of goals for the chocolate industry of the Ivory Coast, can be described as an example of the economic ideal which Karl Marx imagined. By comparing specific topics... Read Article »
|