An Econometric Analysis of the Major Choice of First-Generation College Students
Abstract
Using data from the National Longitudinal Survey of Youth 1997, I estimate a multinomial logit choice model for the college major decisions of first-generation college students|students who are the first in the families to attend college|and non-first-generation students. The model controls for other factors such as sex, race, ability, and family income to isolate the effect of first-generation status on major choice for two otherwise identical students. I find that first-generation college students do make statistically different college major selections than otherwise identical students. I then examine whether the estimated differences between the major selection of first-generation and non-first-generation students is systematically related to characteristics of the majors. In particular, I use data extracted from the American Community Survey to create these measures of safety and stability. First-generation college students tend to be more risk averse than otherwise identical non-first generation students whose parents have attended college, as they are more likely to select majors with well defined career paths, high expected wages, and low unemployment rates.
I. Introduction
In the fall of 2015, over 13 million American students attended 4-year universities1. Needless to say, not all 13 million students attended similar colleges or received a similar academic experience. An incoming freshman might decide to enroll at Arizona State University with annual tuition of about $10,000, over 65,000 undergraduates, and a mix of small and large lectures classes to receive a B.S. in computer science. Contrastingly, another incoming freshmen might instead enroll at Vassar College, with an annual tuition of almost $50,000, under 2,500 undergraduates, and small, discussion based classes to receive a B.A. in Philosophy. The wide range of educational institutions, degrees, and majors present in the United States illustrates a diversity in both the pedagogical philosophies and methodologies held by higher education providers and the resources, preferences, and educational interests of individual students.
To many students, a college education represents a transformative life experience. As Plato wrote over 2000 years ago, "the object of education is to teach us to love what is beautiful," a sentiment echoed on the University of Texas Plan II Honors program's website. There the interdisciplinary liberal arts program is advertised as "an education without boundaries," one "for a life, not for a living." To other students, a college education simply represents a practical investment in their human capital, affording degree holders higher wages and other rewards in the labor market. In 1967, then Governor of California Ronald Reagan embodied this outlook when he famously criticized the University of California system for offering courses on organizing social movements, arguing there was no value in "subsidizing intellectual curiosity" at universities.
Most American students likely view their college education as a healthy compromise of the positions represented by Plato and President Reagan. That is, students pursue education both because it adds value and texture to their lives and because it builds human capital that the labor market rewards. Though normative questions about the proper goals of "good" education are difficult to address concretely, the social and economic repercussions of the existence of a diverse set of higher educational opportunities, like the range of college major options, can be analytically explored.
A student's college major decision is not a trivial one; not only does each college major require a unique set of coursework and talents, but not all college degrees are equally valuable. While a college degree today may be worth more than ever before2, expected earnings vary tremendously across different majors. According to a 2015 report titled From Hard Times to Better Times3 from the Georgetown University Center on Education and the Workforce (GCEW), there exists a wide range in returns to education by major, with median mid-career full-time earnings at $29,000 for Counseling Psychology majors compared to $120,000 for Petroleum Engineering majors. Thus, studying the tendencies in college major choice across demographic groups can serve to deepen an understanding of economic and educational disparities present in America.
Economic and sociological research has long explored how disadvantaged students make decisions differently in regards to higher education when compared to other students. The different contingent factors in a student's life such as their family's monetary constraints, their information about different degree options, and their unique set of cultural expectations likely in uence the type of college degree an individual elects to pursue. In particular, we would expect these factors within a student's life to affect his or her likelihood of selecting different college majors. While some students may be drawn to the renaissance-style education offered by the Plan II Honors program, it may not be a practical or appealing option for all college-bound youths.
Due to the disparate returns to education across different major fields, research targeted at reducing economic and educational inequality should focus not only on investigating motivations of college attendance but also of the selection of a field of study. In this paper, I investigate how first-generation college students differ from other students in their choice of college major. Using data from the National Longitudinal Survey of Youth 1997 (NLSY97), I estimate a multinomial logit choice model for the college major decisions of first-generation college students and non-first-generation students. The model controls for other factors such as sex, race, ability, and family income to isolate the effect of first-generation status on major choice for two otherwise identical students. I find that first-generation college students|students who are the first in the families to attend college|do make statistically different college major selections than otherwise identical students.
I then examine whether the estimated differences in major selection between first-generation and non-first-generation students is systematically related to characteristics of the majors. In particular, I use data from the American Community Survey (ACS) to create measures of the economic safety and stability of different majors. I find that first-generation college students are more risk averse than otherwise identical students who have parents who have attended college and tend to select majors with a well-defined career path, high expected wages, and low expected unemployment.
II. Literature Review
A growing body of economic and sociological research explores how disadvantaged students-namely members of certain minority groups, those from low-income families, and firstgeneration college students-make decisions differently in regards to higher education when compared to other students.
For example, disadvantaged minorities are less likely than other groups to prepare themselves academically for college. Using a nationally representative sample of the National Educational Longitudinal Study (NELS) data set, Stage, Droogsma-Musoba, and Brown4 (2002) found that, controlling for ability, Asian American and White students were more likely than Black, Hispanic, and Native American students to take mathematics courses that would prepare them for college. Furthermore, low-income students are significantly less likely to decide to even apply to college. Using the same data set, Cabrera and La Nasa5 (2002) found that while 76% of high socioeconomic status students submitted applications to fouryear colleges, only 21.3% of low socioeconomic status students applied to college.
Not only are students from these disadvantaged groups less likely to apply to college, but when they do apply they tend to under-match, or in other words, apply to colleges below their academic ability level. Using a recent sample of Texas high school graduates, Black, Cortez, and Lincove6 (2014) investigated race and ethnicity differences in college application decision-making using a sample recent Texas high school graduates. They found that disadvantaged minorities exhibit different college application decisions than Whites and Asians with similar levels of academic achievement. Inequality in college access is magnified through these under-matching tendencies of minority high-performing students. This reinforces the findings of Hoxby and Christopher7 (2012), who first demonstrated the tendency of high-achieving low-income students to choose not to apply to selective colleges.
While the behavior of disadvantaged students leading up to and navigating through higher education is increasingly the subject of academic research, only minor inquiry has been made regarding how these disadvantaged groups tend to select a field of study. Saks and Shore8 (2005) estimated the risk associated with different careers and found education, health care, and engineering careers to have relatively safe streams of labor income; on the other hand, business, sales, and entertainment careers are more risky. Controlling for observable measures of ability and demographic background, they showed that students from low-income families tended to select majors that would result in less risky careers than high-income students.
That little economic research on college major selection has been done is surprising, given the strong connection between college major and labor market outcomes. Recent survey information has provided social science researchers with new data linking one's college major to future employment and financial outcomes. Starting in 2009, the ACS began asking for its respondents to report their college field of study. Altonji, Blom, and Meghir9 (2012) use this data to review literature on the heterogeneous nature of educational specializations and the link between college majors and occupational paths. Amazingly, they find that the "difference in returns across college majors rivals the college wage premium." After adjusting for basic demographics, work experience, and postsecondary degrees, the gap in log wages rates between male electrical engineering and male general education majors is a striking 0.56, nearly as large as the 0.57 difference between college graduates and high school graduates.
In this paper, I expand upon Saks and Shore's work by exploring the additional effect of first-generation status on student college major decisions. In doing so, I am able to separate out the impact of parental education from race and socioeconomic status. By better studying this important educational choice, my research adds to a greater body of work that aims to understand the decisions made by disadvantaged students while preparing for, pursuing, and specializing within higher education.
III. Theory
That low-income students tend to be more risk averse in their college major selection compared to middle and high-income of students is unsurprising. Post-secondary education in America is expensive; there exist substantial explicit academic costs to higher education (namely tuition). These explicit costs are heightened by the implicit opportunity cost of the forgone wages during the time spent in school.
Under perfect credit market conditions, a student might choose to borrow money now for the cost of college only to repay the money later with improved future labor market outcomes. However, human capital cannot be collateralized in the same way that other investments can be, making educational loans riskier than other types of lending. This credit market failure drives up interest rates for college loans, causing an increase in the marginal cost of education for the lowincome students who are forced to take out loans. For this reason, attending college may only be a rational investment for low-income students wishing to specialize in a narrower, more lucrative set of college majors.
My research, however, focuses on the extent to which being a first-generation college student affects an individual's college major choice. First-generation college students are disproportionately from low-income families and members of disadvantaged minority groups in addition to facing a unique set of educational challenges. For these students, going to college is uncharted territory. First-generation college students are likely exposed to less or at least different information about college than those students whose parents have attended college. College, like most things, rewards students with both explicit financial returns and also intangible utility. Firstgeneration college students may lack family member accounts of the non-financial rewards to a college education, leading them to give the expected labor market rewards of a major more relative weight when selecting their field of study.
In addition, because pursuing postsecondary education is atypical for their family and peer group, a first-generation student may be forced to more frequently justify his or her decision or articulate his or her post-graduation plans, thereby incentivizing a more pragmatic major selection. Preference may be given by first-generation college students to majors with higher wages and a more well-defined career path. For example, first-generation students might avoid studying areas such as communications or psychology and instead give preference to degrees in areas such as healthcare or engineering.
Being asked to answer the "Why college?" question might also alter the timeline of the college major decision of firstgeneration students. Many students enter their first year of college as undeclared students or adopt a major only tentatively, but first-generation students may experience pressure to select a major before they get to college. When a student makes their specialization could easily impact the major he or she selects.
Finally, first-generation students are a group comprised entirely of individuals who are is making a decision that is a departure from their familial and social norms. An individual's propensity to "go against the grain" and make such a choice could be the result of particular character traits or interests, which would therefore be more common in first-generation students than other students. This might result in the selection systematically different majors, though the major characteristics that would be preferred remains unclear.
IV. Data Set
I begin by analyzing individual-level data from the National Longitudinal Study of Youth 1997 Cohort10 (NLSY97). The NLSY97 consists of a nationally representative sample of approximately 9,000 youths who were between 12 and 16 years old as of December 31, 1996. The initial round of the survey took place in 1997. In that first round, both the eligible youth and one of the youth's parents received hour-long personal interviews. These youths were asked questions on their family background, education, work, and life decisions and were reinterviewed on an annual basis.
My sample consists of all the individuals in the NLSY97 who completed a 4-year college degree by 2010. Though interesting questions exist on a student's initial college major decision and its effect of major switching and drop-out rates, I limit my study to a student's final major selection. A student's final major can be thought of as their ultimate revealed preference and by using this as my metric of analysis I am able to draw connections between a student's college major and their expected labor market outcomes.
First I construct my college major variable COLLEGE MAJOR. Though the NLSY97 has an already constructed major variable available based off of college transcripts, transcripts for many students were not collected. To increase my number of usable observations, I elect not to use this variable. Instead, I construct my own variable for college major using a self-reported "current college field of study" question that participants were asked on an annual basis. To do so, I order the annual responses from each individual chronologically and use each individual's final non-missing selfreported field of study for their COLLEGE MAJOR value.
To obtain major variables each with a sufficient number of observations, I next group together similar COLLEGE MAJORs to create 11 MAJOR GROUP variables. In constructing these major groups, I worked to strike a sensible balance between groupings based on both similar expected labor market outcomes and related academic content. The few observations with major variables that did not fit well into any categories were dropped from my dataset. These dropped observations were Home Economics, Automotive Mechanics, Transportation & Materials Moving, Security & Protective Services, and Uncodable. The final major groupings of my NLSY97 sample set are displayed in Table 1.
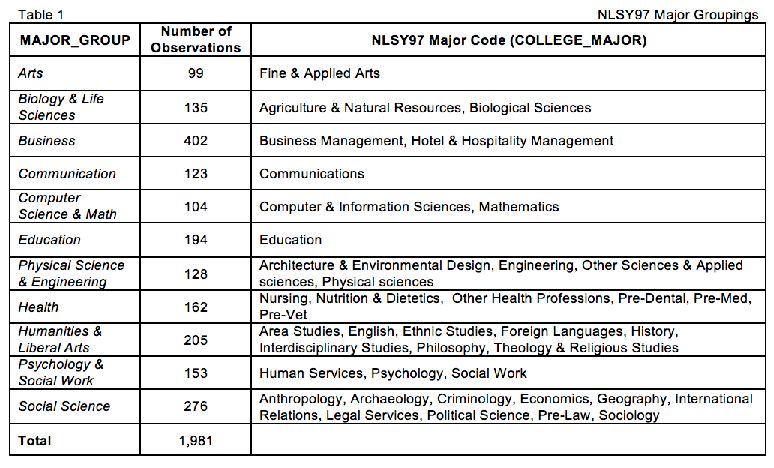
Next, I construct a FG COLLEGE dummy variable for those individuals who never had a parent that attended college. For the purposes of this paper, I define first-generation student as one whose does not have a parent with greater than 12 years of schooling.
Finally, I define several key demographic variables for the individuals in my sample. I begin by creating a FEMALE dummy variable representing a female participant and a BLACK HISPANIC dummy variable representing an individual who is Black or Hispanic. Next, I create a measure of family income. Unfortunately, only the initial year of family income was usable for my analysis. In the year following the initial NLSY97 interview in 1997, a fraction of the youths in my sample set become emancipated. Any income reported thereafter is the individual's own personal income. Because comparing an 18 year old's personal income against 17 year old's family income would be unre ective of their actual relative financial situations, I limited my income measure to just family income in the year of 1997 and call this variable INCOME 1997. For a measure of cognitive ability, I use percentile scores from the Armed Forces Qualification Test (AFQT) to create an AFQT PCT variable.
Unfortunately, a small number of observations are missing values for both AFQT PCT and INCOME 1997; I drop these observations from my dataset. For any remaining observations, I then estimate any missing values for either AFQT PCT or INCOME 1997 by forming predicted values based from OLS regressions with the other 4 variables as independent variables. For example, I estimated 168 missing AFQT PCT values by using an OLS regression with INCOME 1997, FG COLLEGE, FEMALE, and BLACK HISPANIC independent variables.
Table 2 contains summary statistics of my NLSY97 sample. There are several substantial differences in characteristics between the first-generation and non-first-generation members of my sample, suggesting that it might be important to control for these differences in order to isolate the true effect of being a first-generation college student on major selection.
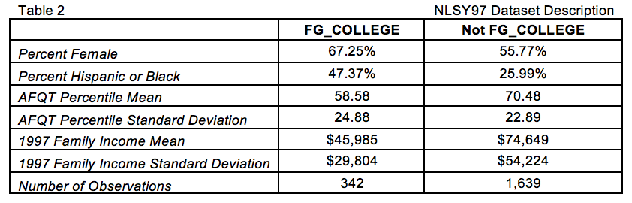
In addition to the NLSY97, I use data from the American Community Survey (ACS) to create variables measuring wages, unemployment rates, and occupational concentrations for recent college graduates. The ACS is an ongoing statistical survey conducted by the U.S. Census Bureau, sent to over 3 million households each year. Beginning in 2009, the ACS began asking for its respondents to report their college field of study, providing researchers with unprecedented access to a large data set linking an individual's college major to their employment and financial outcomes.
I begin with an extract of the ACS that contains over 1.5 million observations from 2009, 2010, and 2011. Because I am primarily interested in measuring the labor market rewards for recent college graduates, I keep only observations on individuals between the ages of 22 and 26, leaving me with just over 60,000 observations11.
Next I have to code the ACS field of study variable into my MAJOR GROUP variable. I tried to be as consistent with my NLSY97 groupings as possible. The final ACS major groupings are displayed in Table 3.
Next I have to code the ACS field of study variable into my MAJOR GROUP variable. I tried to be as consistent with my NLSY97 groupings as possible. The final ACS major groupings are displayed in Table 3.
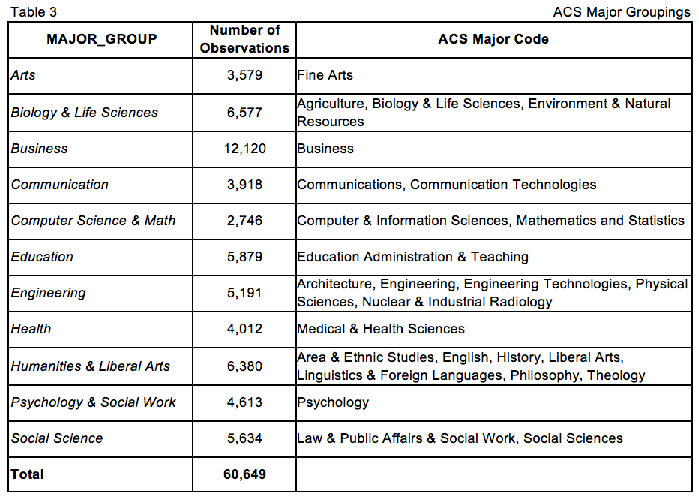
With the ACS data, I construct three major group characteristic variables: occupational concentration, mean hourly wage, and unemployment rate. The occupational concentration variable measures the percentage of all graduates from a given major group that work in the 3 most common occupations for that major group. A detailed table showing the underlying most common occupational fields for each major used to construct this occupational concentration value can be found in the data appendix of this paper. For the occupational groupings, I used occupational fields from the ACS12.
Occupational concentration serves to describe the clarity of the career path of a major group; a major group that has a very high fraction of its graduates employed in the 3 most common occupational groups can be thought of as having a clear career path. In other words, the question of "What can I do after college with this major?" has a relatively more well-defined answer for majors with high occupational concentrations than for majors with low occupational concentrations.
Next I calculate the average hourly wage for each major group. I adjust13 all the wage variables to be in 2010 USD and then remove all individuals who work less than 50 weeks a year. The ACS has only interval data on the number of weeks worked for part-year workers, so I was unable include them when constructing my wage variable. To create a measure of hourly wage for each major group, I divide the annual earnings of every individual in a major group by the number of weekly hours typically worked by that individual times 50. I average all the hourly wages in a particular major group to create my wage variable for that major group.
Finally, I calculate the major group unemployment rate. I simply divide the number of people without jobs seeking work in a particular major group by the total number of people in the labor force from that major group. Chart 4 contains summary statistics from the ACS for each major group.
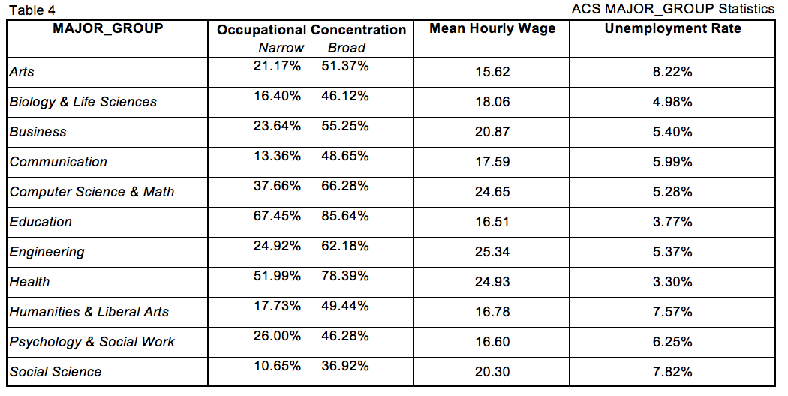
Notice a wide range of values exists for occupation concentration, mean hourly wage, and unemployment rate among the major groups. For example, Arts has an occupational concentration of 51%, a mean hourly wage of $15.6, and an unemployment rate over 8% whereas Health has an occupational concentration of 78%, a mean hourly wage of almost $25, and an unemployment rate of 3.3%. Importantly, a major group's rank in one descriptive category is not always similar to its ranking in the other categories. For example, Education is near the minimum value of mean hourly wage distribution while Health is close to the maximum, but both Education and Health are among the fields with the highest occupational concentrations.
V. Data Analysis
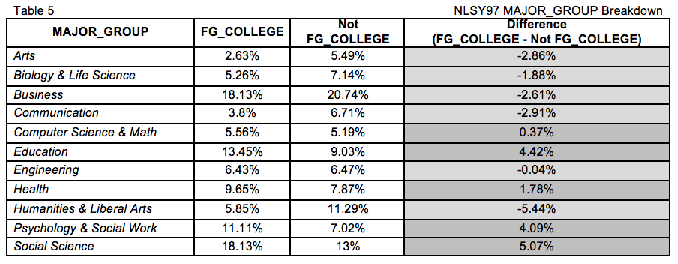
I begin by using my sample from the NLSY97 to construct a native comparison of major choice between first-generation students and non-first-generation students. Table 5 contains a simple breakdown of the percentage of first-generation and non-first-generation students in each major group within my sample.
A statistical significance test rejects the hypothesis that these differences are equal to zero at conventional levels. In other words, this table suggests that there is a relationship between first-generation status and college major selection. However, this sort of analysis fails in addressing my true line of inquiry. As seen earlier in Table 2, first-generation students in my sample set are quite characteristically different than nonfirst-generation students. Specifically, they are more heavily female and minority than non-first-generation students. In addition, first-generation students have lower average AFQT scores and come from families with lower average income. We would expect to observe differences in first-generation students' college major selection fueled by these demographic differences alone. In order to answer the question of the causal impact of first-generation status on college major selection, I need to account for these confounding variables.
In order to isolate the effect of first-generation status on major choice for two otherwise identical students, I use my NLSY97 sample to estimate a multinomial logit choice model for college major decisions. The model has MAJOR GROUP as its dependent variable and FG COLLEGE, FEMALE, BLACK HISPANIC, AFQT PCT, and INCOME 1997 as its independent variables. Because FG COLLEGE is a dummy variable, its average marginal effect measures the average excess likelihood that a first-generation student selects a given major group compared to an otherwise identical non-firstgeneration student. We can think of this value as the average effect of being a first-generation college student on college major selection that is independent of differences in sex, race, family income, and ability.
I next examine whether these estimated differences between a first-generation and a non-first-generation students' likelihood of choosing different major groups are systematically related to the characteristics of the major groups themselves. I consider three separate major group characteristics: occupational concentration, average wage, and unemployment rate. Each one is illustrative of a different aspect of the relative safety and stability of a major group's labor market rewards. Unemployment rates represent the risk of not being able to find suitable work, average wages represent expected pay conditional on employment, and occupational concentration serves to describe the clarity of the career path of a major group.
I create 3 scatter plots, each one with a different major group characteristic on the x-axis and the average marginal effect of FG COLLEGE on the y-axis. Here, I link my college major choice data from the NLSY97 with my college major returns data from the ACS. Unfortunately, with only 11 major groups to use as data points, rigorous statistical tools are unsuited to measure how precisely a major group's characteristics relate to the excess likelihood that first-generation college students select that major relative to otherwise identical nonfirst-generation students. However, the scatter plots at least allow for a visual inspection of the relationship between the variables.Continued on Next Page »