Enhanced Resistance Training Performance via the Neutralization of Lactic Acid with Sodium Bicarbonate
2016, Vol. 8 No. 03 | pg. 2/2 | «
Appendix
Figure 1. Group differences as identified by mean weight used in the Back Squat 1RM test in 4 subsequent training sessions. The figure demonstrates that there were increases in weight in the SB group compared to the Control group (P < 0.05).
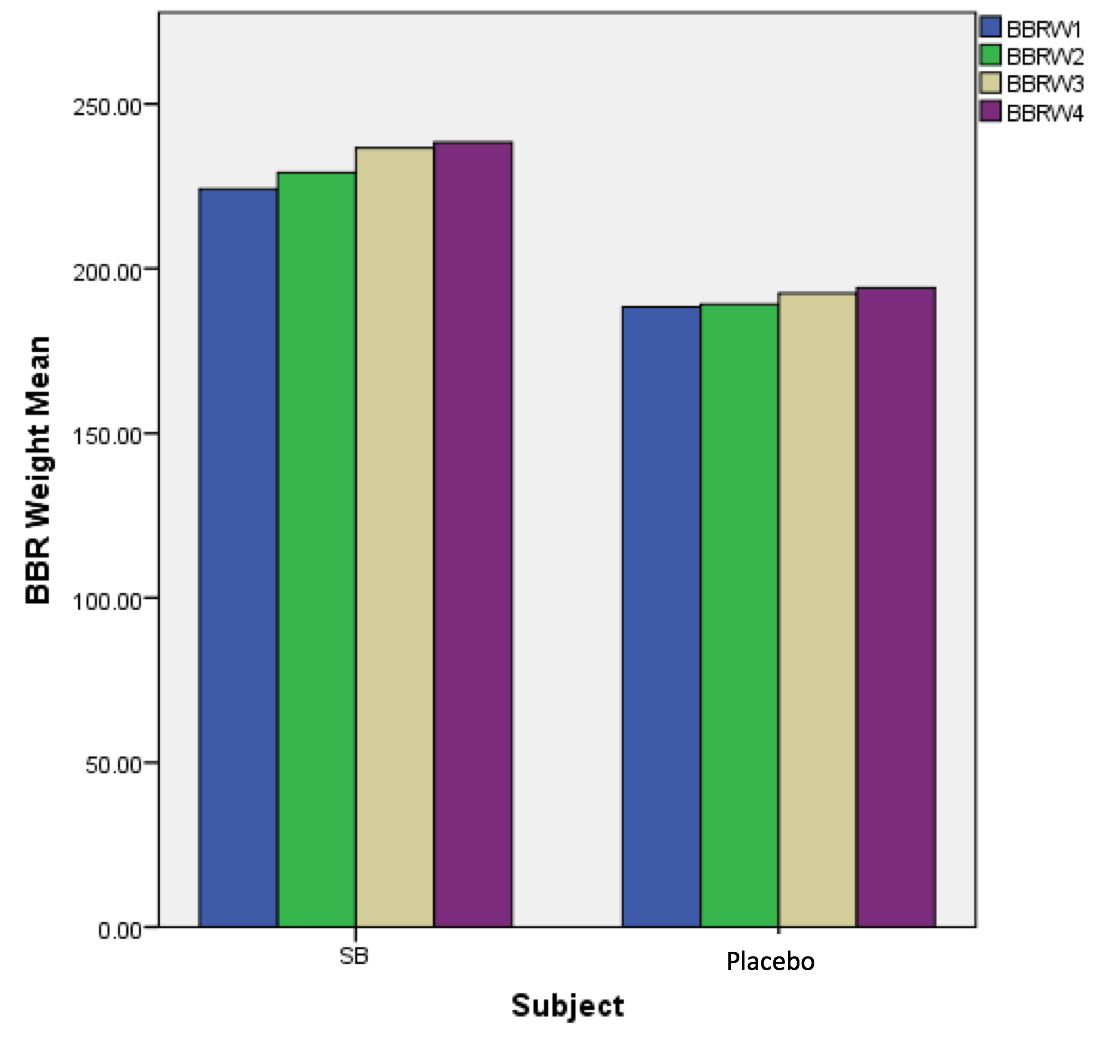
Figure 2. Group differences as identified by mean weight used in the Barbell Row 1RM test in 4 subsequent training sessions. The figure demonstrates that there were increases in weight in the SB group compared to the Control group (P < 0.05).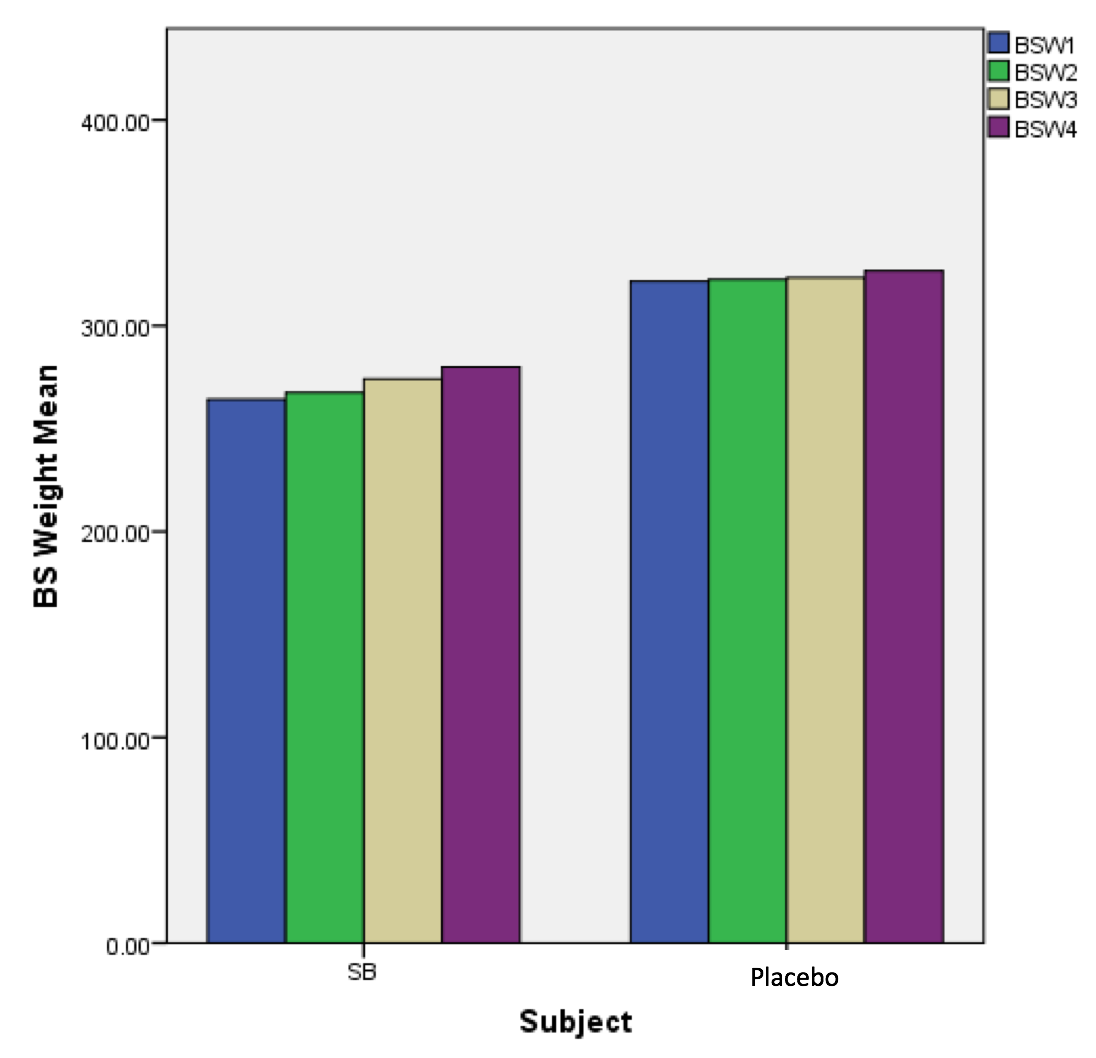
Advertisement
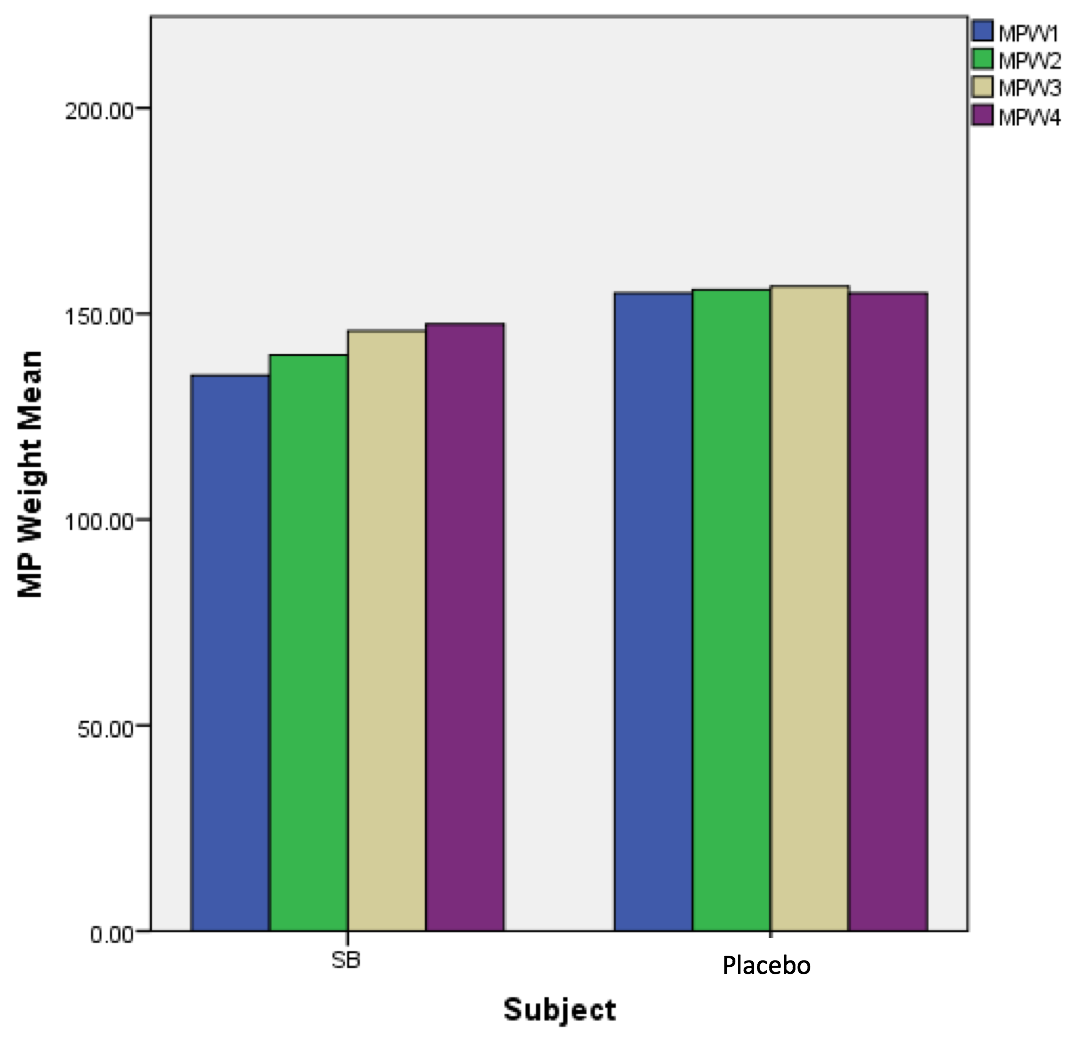
Figure 3. Group differences as identified by mean weight used in the Military Press 1RM test in 4 subsequent training sessions. The figure demonstrates that there were increases in weight in the SB group compared to the Control group (P < 0.05).
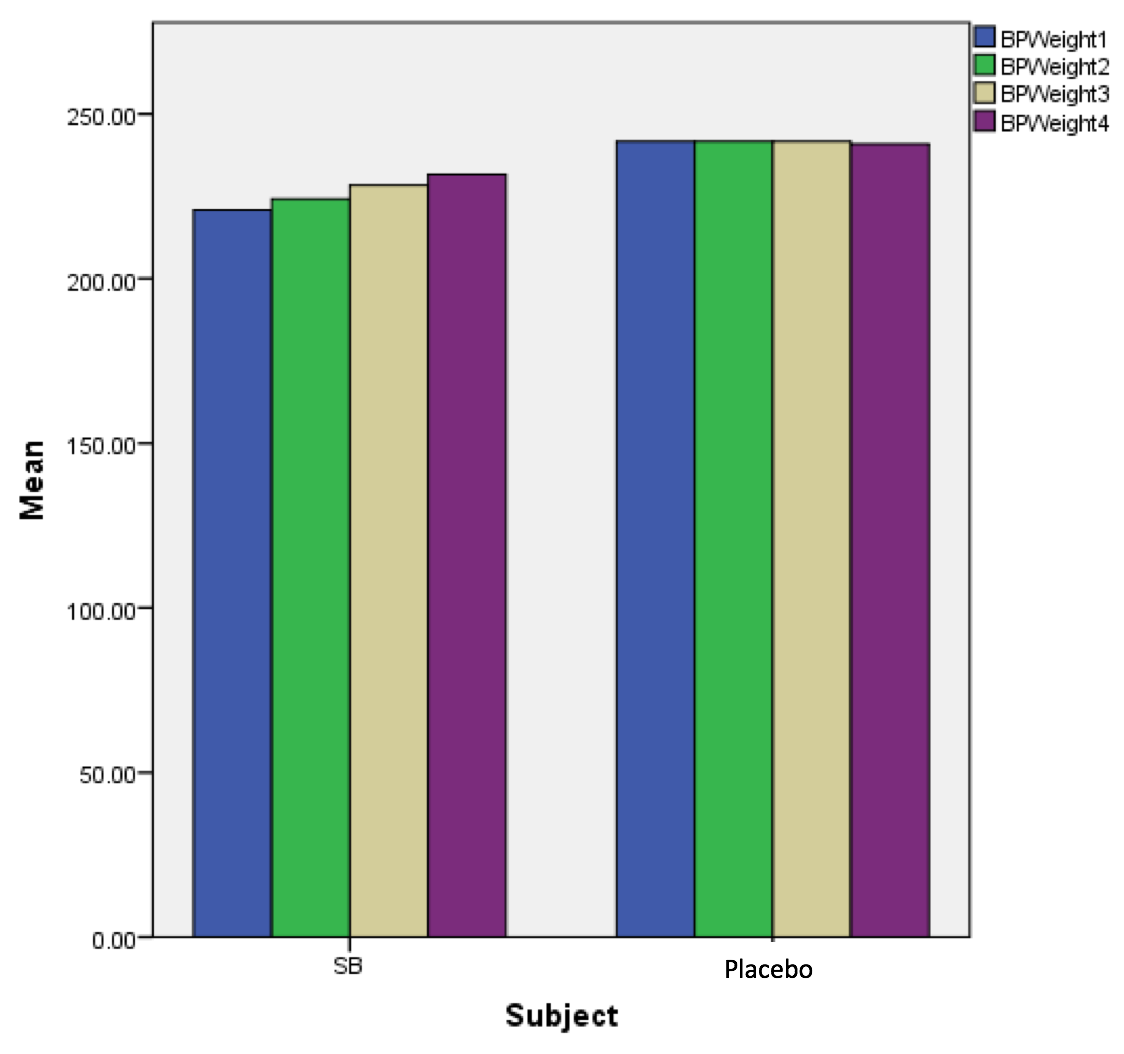
Figure 4. Group differences as identified by mean weight used in the Bench Press 1RM test in 4 subsequent training sessions. The figure demonstrates that there were increases in weight in the SB group compared to the Control group (P < 0.05).
Figure 5. Group differences as identified by mean repetitions performed in the Incline Dumbbell Press endurance test in 4 subsequent training sessions. The figure demonstrates that there were significant increases in repetitions performed in the SB group compared to the Control group (P < 0.05).
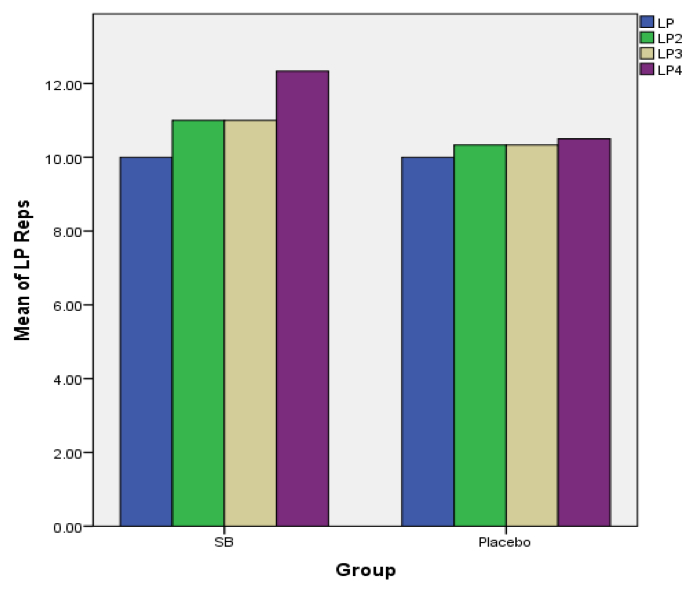
Figure 6. Group differences as identified by mean repetitions performed in the Lat Pull-down endurance test in 4 subsequent training sessions. The figure demonstrates that there were reasonable increases in repetitions performed in the SB group compared to the Control group (P < 0.05).
Figure 7. Group differences as identified by mean repetitions performed in the Leg Press endurance test in 4 subsequent training sessions. The figure demonstrates that there were significant increases in repetitions performed in the SB group compared to the Control group (P < 0.05).
Advertisement
Figure 8. Group differences as identified by mean repetitions performed in the Lateral Raise endurance test in 4 subsequent training sessions. The figure did not indicate significant increases in repetitions performed in the SB group compared to the Control group (P > 0.05)
Table 1. age (yrs), height (m), weight (lbs), body mass index (BMI) calculations for all 12 subjects
| Descriptive Statistics | |||
| N | Mean | Std. Deviation | |
| Age | 12 | 20.0000 | .95346 |
| Height | 12 | 1.7833 | .06746 |
| Weight | 12 | 173.0717 | 9.90828 |
| BMI | 12 | 25.0833 | 1.08362 |
| Valid N (listwise) | 12 | ||
Table 2. Soreness scale values (mean ± SD) for both groups
| Group Statistics | |||||
| Subject | N | Mean | Std. Deviation | Std. Error Mean | |
| Soreness | SB | 6 | 79.8333 | 6.40052 | 2.61300 |
| Placebo | 6 | 52.0000 | 7.37564 | 3.01109 | |
Table 3. Independent sample t-test for soreness scale
| Independent Samples Test | ||||||||||
| Levene's Test for Equality of Variances | t-test for Equality of Means | |||||||||
| F | Sig. | t | df | Sig. (2-tailed) | Mean Difference | Std. Error Difference | 95% Confidence Interval of the Difference | |||
| Lower | Upper | |||||||||
| Soreness | Equal variances assumed | .703 | .421 | 6.981 | 10 | .000 | 27.83333 | 3.98678 | 18.95023 | 36.71644 |
| Equal variances not assumed | 6.981 | 9.805 | .000 | 27.83333 | 3.98678 | 18.92628 | 36.74039 | |||
Table 4. Intensity scale values (mean ± SD) for both groups
| Group Statistics | |||||
| Subject | N | Mean | Std. Deviation | Std. Error Mean | |
| Intensity | SB | 6 | 86.6667 | 2.94392 | 1.20185 |
| Placebo | 6 | 59.0000 | 5.83095 | 2.38048 | |
Table 5. Independent sample t-test for intensity scale
| Independent Samples Test | ||||||||||
| Levene's Test for Equality of Variances | t-test for Equality of Means | |||||||||
| F | Sig. | t | df | Sig. (2-tailed) | Mean Difference | Std. Error Difference | 95% Confidence Interval of the Difference | |||
| Lower | Upper | |||||||||
| Intensity | Equal variances assumed | .984 | .345 | 10.375 | 10 | .000 | 27.66667 | 2.66667 | 21.72496 | 33.60837 |
| Equal variances not assumed | 10.375 | 7.394 | .000 | 27.66667 | 2.66667 | 21.42840 | 33.90493 | |||
Table 6. Improvement scale values (mean ± SD) for both groups
| Group Statistics | |||||
| Subject | N | Mean | Std. Deviation | Std. Error Mean | |
| Improvement | SB | 6 | 85.0000 | 4.19524 | 1.71270 |
| Placebo | 6 | 47.6667 | 4.92612 | 2.01108 | |
Table 7. Independent sample t-test for improvement scale
| Independent Samples Test | ||||||||||
| Levene's Test for Equality of Variances | t-test for Equality of Means | |||||||||
| F | Sig. | t | df | Sig. (2-tailed) | Mean Difference | Std. Error Difference | 95% Confidence Interval of the Difference | |||
| Lower | Upper | |||||||||
| Improvement | Equal variances assumed | .018 | .897 | 14.133 | 10 | .000 | 37.33333 | 2.64155 | 31.44760 | 43.21907 |
| Equal variances not assumed | 14.133 | 9.753 | .000 | 37.33333 | 2.64155 | 31.42730 | 43.23936 | |||