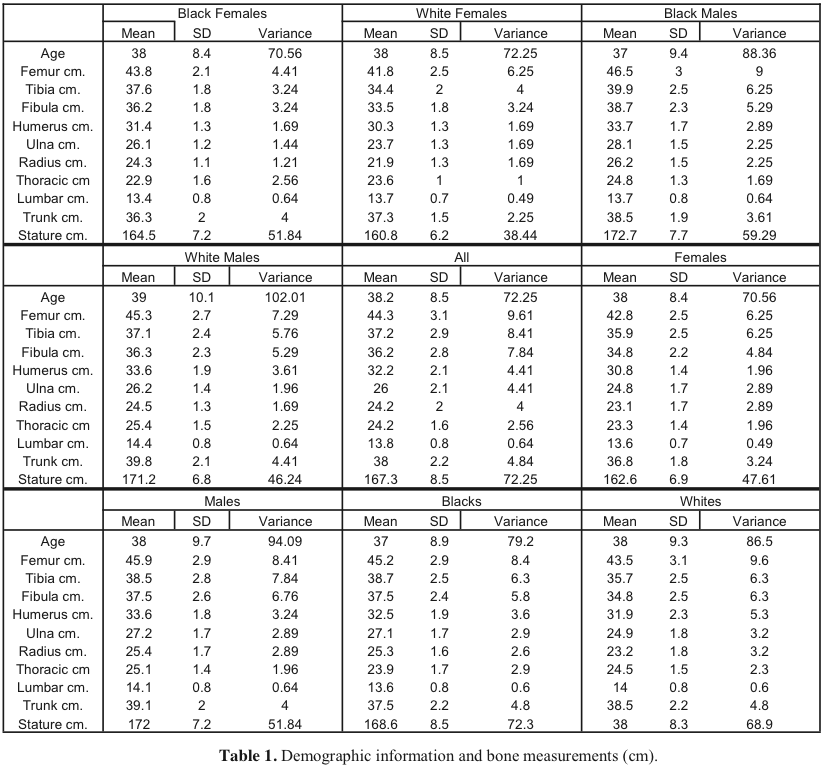
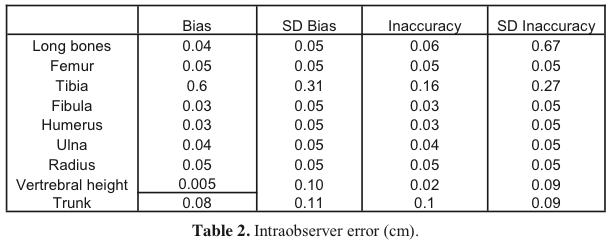
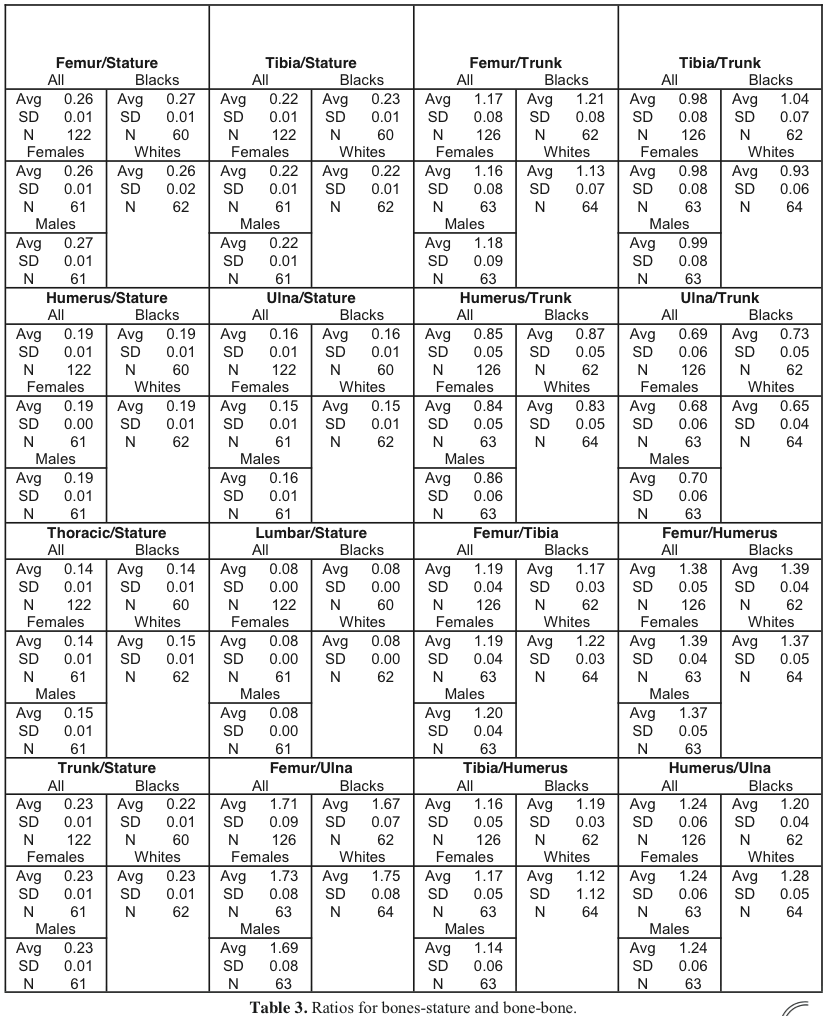
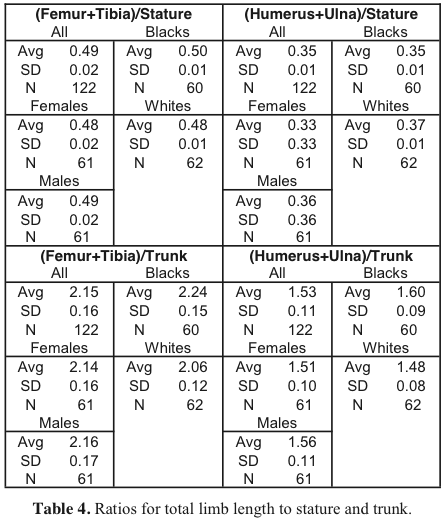
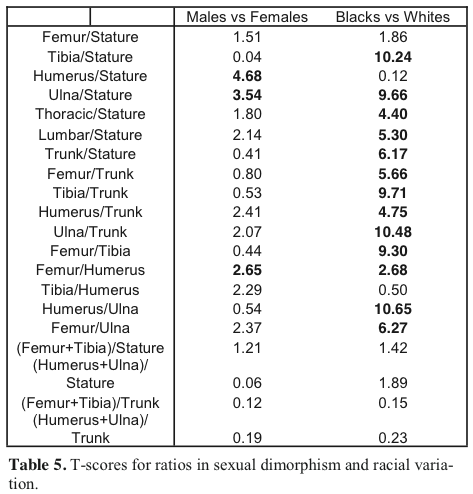
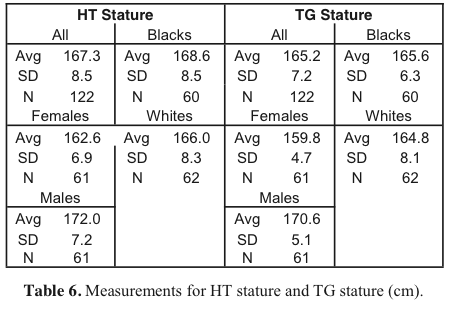
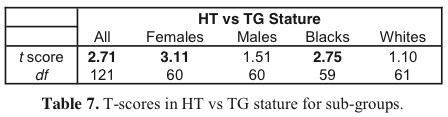
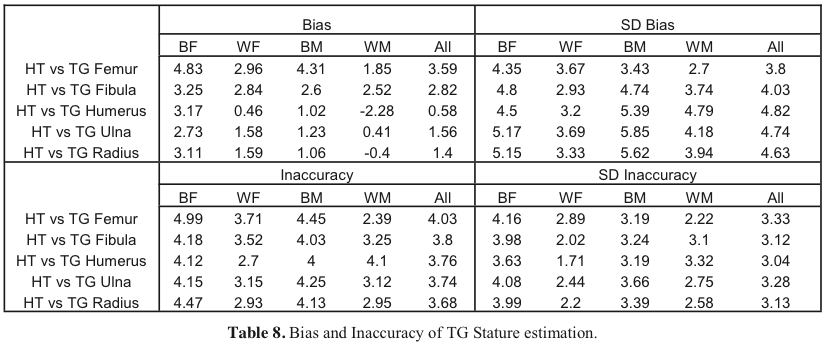
From Discussions VOL. 5 NO. 1Covariation in Limb-limb and Limb-trunk Proportions in Whites and Blacks and Males in Females using the Hamann-Todd Collection, Cleveland Museum of Natural HistoryMETHODS AND MATERIALSBones were collected from a total of 126 individuals representing four American populations that died between the years of 1912-1938 from the Hamann-Todd collection at the Cleveland Museum of Natural History (henceforth will be referred to as CMNH). Groups were divided into the following subgroups: 30 Black females; 32 Black males; 33 White females; 31 White males; all females; all males; all Blacks; and all Whites. Only nonpathological specimens between the ages of 20 and 55 years were chosen with no obvious distortion in the maximum or physiological lengths. All of the long bones were taken from the right side of the body unless there was damage or deformities, in which case the left side was used. All twelve thoracic and all five lumbar vertebrae needed to be present in order to be included in the study. All of the long bones were measured for maximal height using a standard osteometric board. The femur's bicondylar length was measured by placing both condyles against the base and marking the maximum spot on the head of the femur. Maximal lengths were taken for the rest of the long bones. The trunk was divided into a thoracic region and a lumbar region. Each region was then measured by adding the anterior vertebral heights of the respective section. The anterior vertebral height was measured using a digital sliding caliper. All measurements were in centimeters; those of the long bones were rounded to the nearest tenth, and those of the vertebrae were rounded to the nearest hundredth. According to the written records provided by the CMNH, the living stature was measured post-mortem on the cadavers by hanging the body vertically with the feet flat on the floor. All four limb segments were represented by their corresponding long bones: the femur is the thigh, the tibia and fibula are the shin, the humerus is the upper arm, and the ulna and radius are the lower arm. Both bones of each distal limb were included to test for any significant difference between the two. Comparisons were made between the leg (femur and tibia) and the trunk, as well as the arm (humerus and ulna) and trunk. Finally, comparisons were made between true stature (HT, as measured by Todd) and predicted stature (TG, using the formulae provided by Trotter and Gleser, 1952). The stature measured by Todd is considered to be equivalent to living statures (Dupertuis and Hadden, 1951). The statistical calculations made were: bias, inaccuracy, mean, standard deviation, variance, least squares regression, and the simple t-test for both one sample and two samples. Bias is defined as directional error from zero; inaccuracy is defined as the magnitude of error. The α-level was set at 0.01.2 RESULTSThe mean, standard deviation and variance are plotted in Table 1 for age and bone lengths. On average, I overmeasured the long bones by 0.4 mm (0.1%); the inaccuracy was 0.6 mm (0.2%). I tended to over-measure the vertebral heights by 0.05 mm (0.2%) with an inaccuracy of 0.2 mm (0.9%). The greatest inaccuracy was in the tibia (1.6 mm.) and the least in the fibula and humerus (0.3 mm.). The greatest amount of bias was in the tibia (0.6 mm) and the least in the fibula and humerus (0.3 mm.). See Table 2 for intraobersever bias and inaccuracy. There was significant correlation between the lengths of each long bone to one another. There was a highly significant correlation between the tibia and the fibula, and also between the ulna and the radius. In order to avoid redundancy, only the tibia was used to represent the distal lower limb segment, and only the ulna was used to represent the distal upper limb segment. There was significant correlation between the limb segments and the length of the trunk when the subgroups were divided based on race, but not when the subgroups were divided based on sex. For the population as a whole, there was significant correlation between the lengths of the long bones and the length of the trunk. White males showed significant correlation between the length of the femur and the length of the trunk, as well as the length of the ulna and the length of the trunk. However there was no significant correlation between the length of the tibia or the length of the humerus and the trunk. There was no significant correlation between any of the long bones and the length of the trunk for any of the other subgroups. There was significant correlation between the length of each long bone and stature. Overall, the femur was the highest correlate to stature (r = .86). The femur and the humerus both had the highest values of correlation (r = .81) in Black females. In White females, the tibia was the best correlate to stature (r = .89). The humerus was the best correlate (r = .85) among females as a whole. The femur was the highest correlate in Black males (r = .88) and in White males (r = .92). For Blacks, the femur, tibia and humerus had equal values of correlation (r = .85). The femur was the highest correlate with stature (r = .91) for Whites. All sub-groups had significant correlation between the lumbar vertebrae and stature, except for Black males. There was correlation between the thoracic vertebrae in Blacks (r = .50) and Whites (r = .63), but not in the sub-groups divided by sex. However, White males had a significant correlation (r = .51). There was also significant correlation between trunk (thoracic + lumbar) and stature for all subgroups, except for Black males. There was significant difference between the means of males and females in the humerus-stature (t = 4.68), ulna-stature (t = 3.54), and femur-humerus ratio (t = 2.65). Men have a higher ratio than women in both comparisons. There was significant difference between the means of Blacks and Whites in all of the ratios3, except for femur-stature, humerus-stature and tibiahumerus. Blacks have higher ratios than Whites in the all of the following comparisons: tibia-stature; ulnastature; femur-trunk; tibia-trunk; humerus-trunk; ulnatrunk; femur-humerus. Whites have higher ratios than Blacks in all of the following comparisons: thoracicstature; lumbar-stature; femur-tibia; humerus-ulna; femur-ulna. There was no significant difference between the means of femur-stature or tibia-humerus. There was also no significant difference between the ratios of total limb length to stature or total limb length to trunk size in either males and females or Blacks and White. Overall, the TG equation using the femur correlated had the highest correlation to actual stature (r = .89). The order from greatest to least following the femur is: fibula, radius, ulna and humerus. In Black females, the equation using the humerus was the highest correlate (r = .82), the one using the ulna was the least (r = .71). The equation using the fibula was the highest correlate to stature in White females (r = .89), and the one using the femur was the least (r = .82). The equation using the femur was the highest correlate in both Black males (r = .88) and White males (r = .92). The ulna was the least accurate in Black males (r = .72) and the humerus in White males (r = .69). There was significant difference between true stature and predicted stature for the entire group when looked at as a whole, among females, and among Blacks. There was no significance between the difference of means in true stature and predicted stature for males or Whites. For the group taken as a whole, TG underestimated stature for every long bone by an average of 1.99 cm. The equation for the femur had the highest bias with a measure of 3.59 cm. while the humerus had the lowest level of bias by 0.58 cm. TG underestimated stature for every sub-group, but by the least amount in White males (0.42 cm), and the most in Black females (3.42 cm.). On average, TG underestimated stature by 2.03 cm more in Blacks than in Whites. TG underestimated the stature of Black females by 3.42 cm. For Black females, the equation using the ulna gave the least amount of bias (2.73 cm.). The femur gave the highest amount of bias with a measure of 4.83 cm. TG underestimated stature for White females by 1.89 cm. The equation using the femur was the highest degree of bias (2.96 cm.) and the humerus gave the least (0.46 cm.). TG underestimated stature in Black males by 2.95 cm. The equation using the femur had the highest level of bias (4.31 cm.), and the one using the humerus gave the least (1.02 cm.). TG also underestimated stature in White males by 0.42 cm. The equations using the humerus and the radius both overestimate stature, by an average of 1.34 cm. while the equation using the fibula had the greatest amount of bias (2.52 cm.) and the one using the radius had the least (-4 mm.).4Continued on Next Page » From the Inquiries Journal Blog   Related ReadingJournalQuest is a free program to help academic student publications increase online readership and distribution. If you are interested in enrolling a journal at your school, please visit the JournalQuest website. Monthly Newsletter SignupThe newsletter highlights recent selections from the journal and useful tips from our blog. Suggested Reading from Inquiries Journal
Inquiries Journal provides undergraduate and graduate students around the world a platform for the wide dissemination of academic work over a range of core disciplines. Representing the work of students from hundreds of institutions around the globe, Inquiries Journal's large database of academic articles is completely free. Learn more | Blog | Submit Follow IJ
Latest in Anthropology |