Featured Article:The Impact of Economic Complexity on Productive Structure and Income Inequality in Indonesia & Venezuela
By
2020, Vol. 12 No. 09 | pg. 1/1
IN THIS ARTICLE
KEYWORDS
AbstractRecent work with the Economic Complexity Index (ECI) has shown that a country’s productive structure constrains its level of economic growth and income inequality. Building on previous research that identified an increasing gap between Latin America and the Caribbean (LAC) with that of China and other High Performing East Asian Economies (HPEA), this paper compares how the diverging productive structures of the Venezuelan and Indonesian economies have impacted the generation and distribution of income in each country. I use time-series regression analysis to show the impact of economic complexity – controlling for additional economic and political variables. Moreover, this paper considers how industrial policies and the resource curse have impacted the underlying productive structure of the economy in both nations. The paper argues that Indonesia’s success in diversifying its economy away from oil exportation and building a more complex economy has led to lower income inequality. Conversely, Venezuela’s increasing reliance on oil has led to higher income inequality despite substantial redistributive policies. Finally, the paper discusses how LAC reliance on the exportation of commodities has serious implications for income inequality because the productive structures of an economy also act as structural constraints on income inequality. Economic Complexity and Income InequalityIncreasing income inequality has been a point of concern in many nations over the last 30 years. Political scientists and economists to better understand the causes of rising income inequality; however, research remains in dispute. Rising income inequality has been shown to lead to slower economic growth by depressing aggregate demand and stagnating wages, while also leaving households relying on debt to maintain spending. New research done at the Massachusetts Institute of Technology has found the underlying productive structures of a country’s economy as a contributing factor for the level of income inequality observed (Hartmann, Guevara, Jara-Figueroa, Aristarán, & Hidalgo, 2017). According to the World Bank, rising income inequality in developing countries has been linked to the underlying productive structure of a country’s economy. The majority of new studies that measure the productive structures of an economy use the new Economic Complexity Index (ECI). Analysis of countries’ productive structures done during the twentieth century was simplistic: only measuring economic diversity by assessing the percentage of individuals employed by agriculture, manufacturing and service sectors (Hartmann et al., 2017). This approach was developed by Albert O. Hirschman, an economist. Despite its intuitive nature, it was too broad a measure, in part due to sectors not being adequately defined or uniformly measured. The limitations of Hirschman and others’ approaches necessitated the need for the Economic Complexity Index (ECI), which is designed to measure the sophistication of a country’s productive structure by combining information about the diversity of its products (the number of products) and the ubiquity of its products (the number of countries that export each product)(Hartmann et al., 2017). A higher ECI is a representation of a more complex economy. Conversely, a lower ECI indicates low diversity and high levels of ubiquity in the goods a country produces.
More simply, the ECI provides a useful rank order that places nations with similar exports near each other. Using United Nations (UN) export data, the ECI sorts the diversity and ubiquity of all countries’ exports for a given year and generates a ranking using both measures to correct for each other mathematically. Note that diversity captures how many exports a country is competitive in and ubiquity captures what type of exports. The ECI combines ubiquity and diversity and attempts to infer about countries productive capabilities or complexity by making relative comparisons across export baskets (Mealy, Farmer, & Teytelboym, 2017).
Figure 1: Visual Representation of the Economic Complexity Index (ECI) from “A New Interpretation of the Economic Complexity Index” by Mealy, Farmer, & Teytelboym, 2017 Figure 1 illustrates how the ECI provides a rank ordering of countries in terms of export similarity. For example, developed countries, such as the United States, Japan, and Germany have high ECI and produce complex goods like medical equipment and other capital goods. Conversely, developing countries, such as Bangladesh, Laos, and Cambodia have low ECI and produce simpler labor-intensive goods like textiles. Panel (a) shows how countries with a positive ECI are on the right segment of the graph and countries with negative ECI fall on the left segment. The network visualization in Panel (b) depicts country nodes with color corresponding their ECI value; shades of green represents positive ECI values and shades of pink represent negative values. Connections between nodes represent similar exports. The ECI is a new measure of underlying productive structures, but prior endogenous growth models have also emphasized the importance of knowledge accumulation as well as product diversification and specialization as critical drivers of economic growth (Natarajan, 2013). In this respect, the ECI is not revolutionary as much as it is evolutionary as it attempts to quantify the productive knowledge in a given country’s economy by observing the goods it produces. As mentioned, the Atlas of Economic Complexity uses UN export data to compute the ECI; this reliance on export data means it may be a less accurate measurement for the productive capabilities of larger economies, such as the US, which are service-based on not substantial exporters (Natarajan, 2013). Theoretically, the ECI formulas could be modified to use data on the composition of both goods and services, but the lack of a comprehensive data set and uniform categorization of services make this difficult if not impossible. Despite these issues, the ECI remains relevant when considering developing countries where exports are a substantial part of the domestic economy. With regards to Indonesia and Venezuela exports represented over 25% of both countries’ GDP, on average, for the time period under consideration (World Bank, 2016). Statistical analysis from previous studies using the ECI has found it a significant predictor of economic growth and income inequality (Hartmann et al., 2017; Hartmann, Jara-Figueroa, Guevara, Simoes, & Hidalgo, 2016; C. A. Hidalgo & Hausmann, 2009). The ECI is statistically a more accurate predictor of per capita GDP growth than measures of governance, competitiveness (World Economic Forum's Global Competitiveness Index), and human capital (as measured in terms of educational attainment) (Hausmann et al., 2011). Hartmann’s most recent study observed that the variety of products a country produces acts as a predictor of an economy’s given path of specialization and level of economic growth (see Figure 2). Multiple other studies have also observed a strong correlation between a country’s level of economic complexity (ECI) and the corresponding level of income inequality between 1968 and 2008 (Gala, Rocha, & Magacho, 2018; Hartmann et al., 2017, 2016).
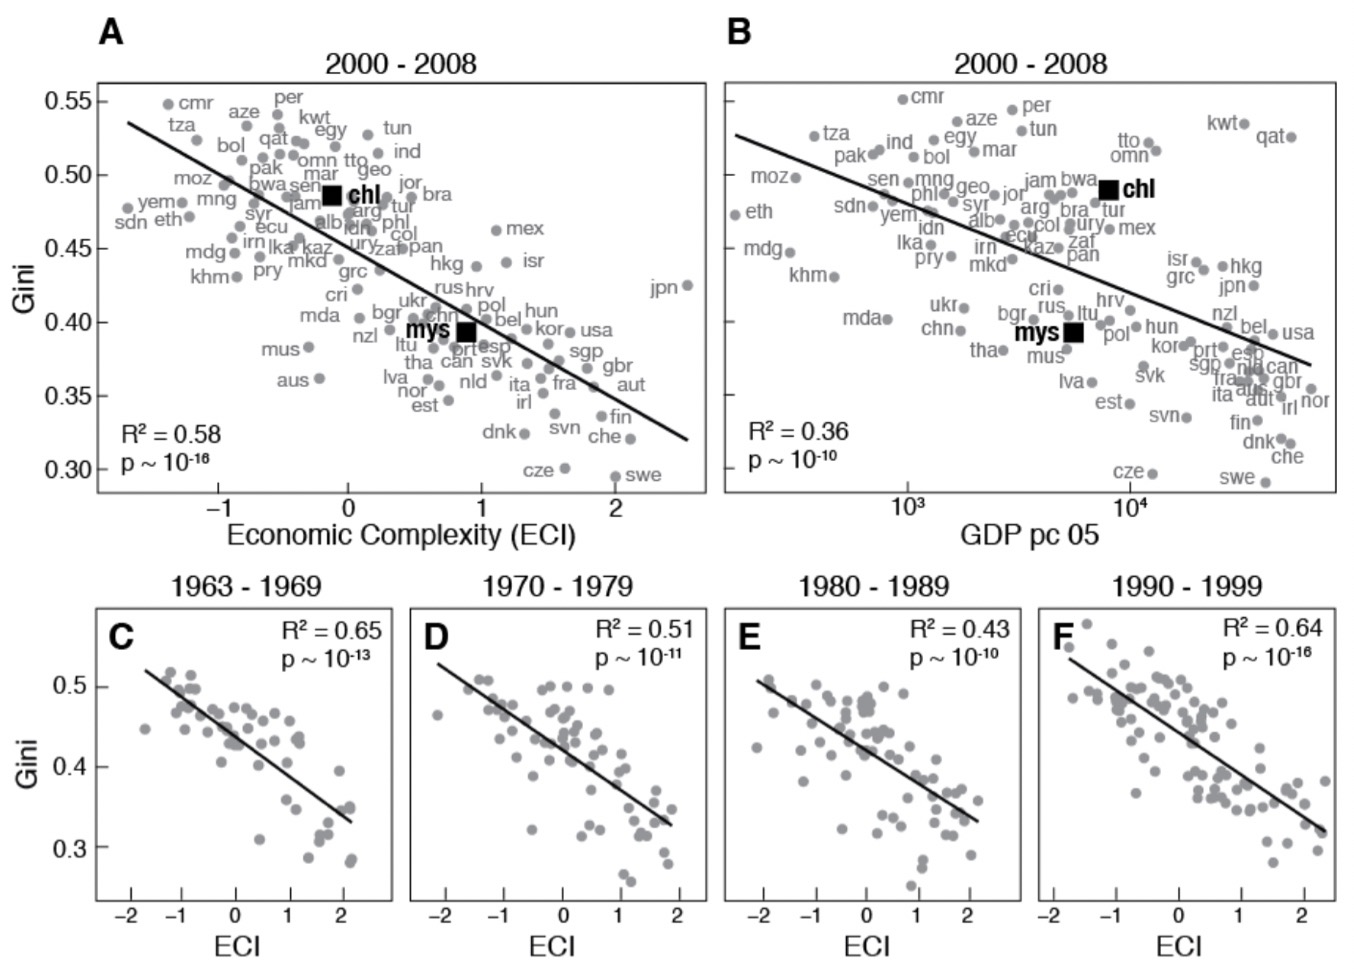
Figure 2: Bivariate relationship between economic complexity and income inequality from “Linking Economic Complexity, Institutions and Income Inequality” by D. Hartmann, Guevara, Jara-Figueroa, Aristarán, & Hidalgo, 2017 Figure 2 illustrates a bivariate relationship, using the Economic Complexity Index (ECI) as the independent variable, between economic complexity and income inequality across different decades from 1963-2008. The graphs illustrate how the ECI is negatively correlated with the Gini coefficient – after controlling for GDP per capita and other macroeconomic indicators. However, the negative relationship between economic complexity and income inequality is stronger (R2=0.58) than the relationship between income inequality and GDP per capita (R2=0.36). Furthermore, the figure shows that the negative relationship between income inequality (Gini) and economic complexity (ECI) remains stable from 1963-2008. Several other studies have also quantified and shown that, across all decades, there exists a negative relationship between economic complexity and income inequality (Gala et al., 2018; Hartmann et al., 2016; Hausmann et al., 2011). There are multiple reasons why the economic complexity (ECI) of a given country is associated not only with economic growth, but also with a country’s average level of income inequality. The complexity and diversity of products that a country exports are a good proxy for the knowledge available in an economy that is not captured by other measures of human capital, such as schooling, which is measured by the percentage of the population with a secondary education (Hartmann et al., 2017). For example, complex industries, such as advanced medical equipment, require better-educated and more creative workers and institutions that are able to include the creative inputs of workers into the activities of firms (Hartmann et al., 2016). A nation’s degree of economic complexity can be seen as a proxy for factors such as the productive knowledge and the inclusiveness of institutions which profoundly affect economic growth and inequality, but which are typically difficult to measure directly. Without sound institutions maintaining the rule of law and high levels of human capital, it is impossible to have a complex economy. The quality of institutions and education are responsible for, and develop alongside, a complex growing economy (Hartmann et al., 2016). The ECI is sufficiently broad that a stronger statistical correlation can be found between it and income inequality over other aggregate measures like years of schooling (Hartmann et al., 2016). Research using the ECI has bought new attention to large disparities in the productive structure between Latin American countries (LAC) and High-Performing East Asian countries (HPEA). These disparities are shown when observing how the ECI has diverged across nations in the two regions despite a degree of convergence in per capita GDP (PPP). Further research using the ECI has shown a gap in the productive capabilities and opportunities for inequality reduction of LAC and HPEA. HPEA have been capable of increasing their level of economic complexity and thus overcoming structural constraints on income inequality as expressed in the decline of income inequality (Hartmann et al., 2016). However, LAC are still strongly constrained by their natural resource centric productive structures, and income inequality has remained high despite comparable per capita economic output. To understand this trend, it would be beneficial to compare individual nations in the two regions and explore how their economic and political development have impacted the level of income inequality. This paper compares Indonesia and Venezuela to illustrate how both nations have diverged and are proxies for broader economic and political trends across Latin America (LAC) and East Asia (HPEA). The primary focus is comparing how income inequality in both countries has been impacted by changes in the underlying productive structures of each is economy. The ECI is the primary independent variable of interest, and it has substantial benefits over using only values such as per capita GDP that does not capture changes in the underlying productive structures of an economy. The ECI is also an important benchmark for the relative success of economic development strategies that rely on Export-Oriented Industrialization (EOI) since the index measures the diversity and ubiquity of goods that an economy produces. Indonesia (East Asia) and Venezuela (Latin America)The focus on Indonesia and Venezuela is due to each nation’s representation of broader trends between High-Performing East Asian countries (HPAE) and Latin American countries (LAC). Neither of the aforementioned countries have reached the late stages of economic development, seen in Japan or Chile. Despite a degree of convergence in GDP per capita values in the two regions, there remain large disparities in income inequality which can be tied to differences in the knowledge and productive capabilities of nations in each region (Hartmann et al., 2016). These disparities are echoed when looking at Indonesia and Venezuela. Both nations have distinct macroeconomic and historical similarities and differences that must be understood in order to fully comprehend each nation’s development (or lack thereof) and levels of income inequality over the last 60 years. Macroeconomically, both are classified as middle-income countries with per capita gross national incomes between $1026 and $12,475 (2011 US Dollars). They have comparable levels of human capital (years of schooling) and similar demographic structures with neither nation exhibiting irregularities in gender or age distribution (World Bank, 2016). Another important similarity is that both nations, in the 1960s and ‘70s, had economies that were heavily dependent on oil extraction and exportation. Venezuela is well known for having the largest proven oil reserves in the world (Fisher & Taub, 2017b). Indonesia was also a considerable exporter of petroleum products, and was the only East Asian nation in the Organization for Petroleum Exporting Countries (OPEC) until recently (Salna & Rusmana, 2017). The presence of natural resources in both countries is relevant when considering the resource curse where oil wealth plagues non-resource-related development and inhibits institutional development (Michael L. Ross, 1999). Unlike other East Asian nations, Indonesia did not lack natural resources and could have feasibly relied on oil revenues and not diversified its economy; however, it chose to pursue export-led industrialization which has been responsible for faster growth and lower levels of income inequality. After WWII, Indonesia, like many nations in Southeast Asia, found itself in a vulnerable position as an economically and militarily weak state that was plagued by religious and ethnic conflicts. Indonesian leaders transformed those fears of war and instability into a remarkable developmental energy that eventually became a binding agent for growth. The pursuit of wealth in the context of stability, security, and catching up with the rest of the world were vastly more effective in generating developmental energy than a general appeal to increase welfare, which is a common thread among Latin American “populism.”(Woo-Cumings, 1999). The absence in Latin America of the kind of vulnerability and urgency one finds in East Asia has to do with Latin American nations attaining political independence and beginning industrialization a century earlier. Latin American nations, including Venezuela, were never “late developers,” and thus never had nor developed the sustained nationalism needed to provide the impetus to modernize (Woo-Cumings, 1999). Additionally, the wealth of natural resources available to Latin American nations, combined with their relatively small populations, provided an easy alternative to the difficult task of industrialization. The timing and manner of Latin America’s involvement with the world economy and relative economic position within it was structurally different from that of many High-Performing East Asian Countries (HPEA). These fundamental differences between the two regions meant contrasting growth models with HPEA (Indonesia) adopting Export Oriented Industrialization (EOI), while LAC (Venezuela) relied on Import Substitution (ISI) and over-valued exchange rates (Müller, 2014). MethodologyDatasets were compiled from the University of Texas Inequality Project (GINI EHII), World Bank, MIT Observatory of Economic Complexity and the Center for Systemic Peace. The most recent observations across the variables are from 2013, and income inequality (Gini) data is unavailable before 1964. Due to lack of reliable income distribution data for Venezuela from 2007 onward, the data set and all regression analysis between the ECI and Gini coefficient occurs from 1965-2006. The data available on Indonesia is more comprehensive, and the data set includes Gini coefficients from 1970-2013.
Time series regression analysis is used as it is the most practical and efficient method of measuring the relationship among income inequality (Gini), economic complexity (ECI), and political stability (Polity IV) while also considering additional factors that influence income inequality. The Gini-coefficient is the dependent variable and is intended to measure income inequality. It does this by plotting the distribution of a given country’s income on a Lorenz curve and then deducting the area occupied by the curve from the line of equality (Mcgreevey, 2013). More simply, the Gini index is a number that lies between 0 (perfect equality—everyone has the same) and 100 (perfect inequality, with one person having everything). Income inequality is assessed rather than wealth inequality because the distribution of wealth in an economy is the product of past economic structures while the income distribution is representative of current structures. All Gini data is taken from the University of Texas Income Inequality project (GINI EHII). Real GDP Per Capita is calculated by dividing a country’s total Gross Domestic Product (GDP), a measure of its total output, by its population to roughly estimate the total output of each individual in that country. Real per capita GDP is used in comparing Indonesia and Venezuela because it shows each country’s relative performance (Ilter, 2017). Furthermore, to effectively compare countries, differing price levels must be considered and thus, all real GDP figures are adjusted to purchasing power parity (PPP) dollars. Note that all GDP data used was taken from the World Bank’s World Development Indicators (World Bank, 2016). As mentioned previously, the Economic Complexity Index (ECI) is the primary independent variable of interest and is used as a measure for measuring the productive structures of a respective country’s economy. Note that a modified measure of economic complexity called the ECI+ was recently developed and new research has shown it is a more accurate predictor of future economic growth; it was not in included because it was published after data analysis for this paper had been completed (Albeaik, Kaltenberg, Alsaleh, & Hidalgo, 2017). The ECI data was accessed from the MIT Observatory of Economic Complexity website (C. Hidalgo & Simoes, 2018). Lastly, the Polity IV score, sometimes called the democracy score, is used as a measure of a country’s democratic institutions and free nature. The score ranges from -10 (worst) to 10 (best) and the minimum score for a country is contingent on whether a country is classified as a democracy, anocracy or autocracy. A degree of political stability by no means guarantees low levels of income inequality, but the type of regime could have a substantial impact on distribution of income via redistributive polices. Polity IV score data is available at the Center of Systematic Peace (2013). ResultsIndonesia
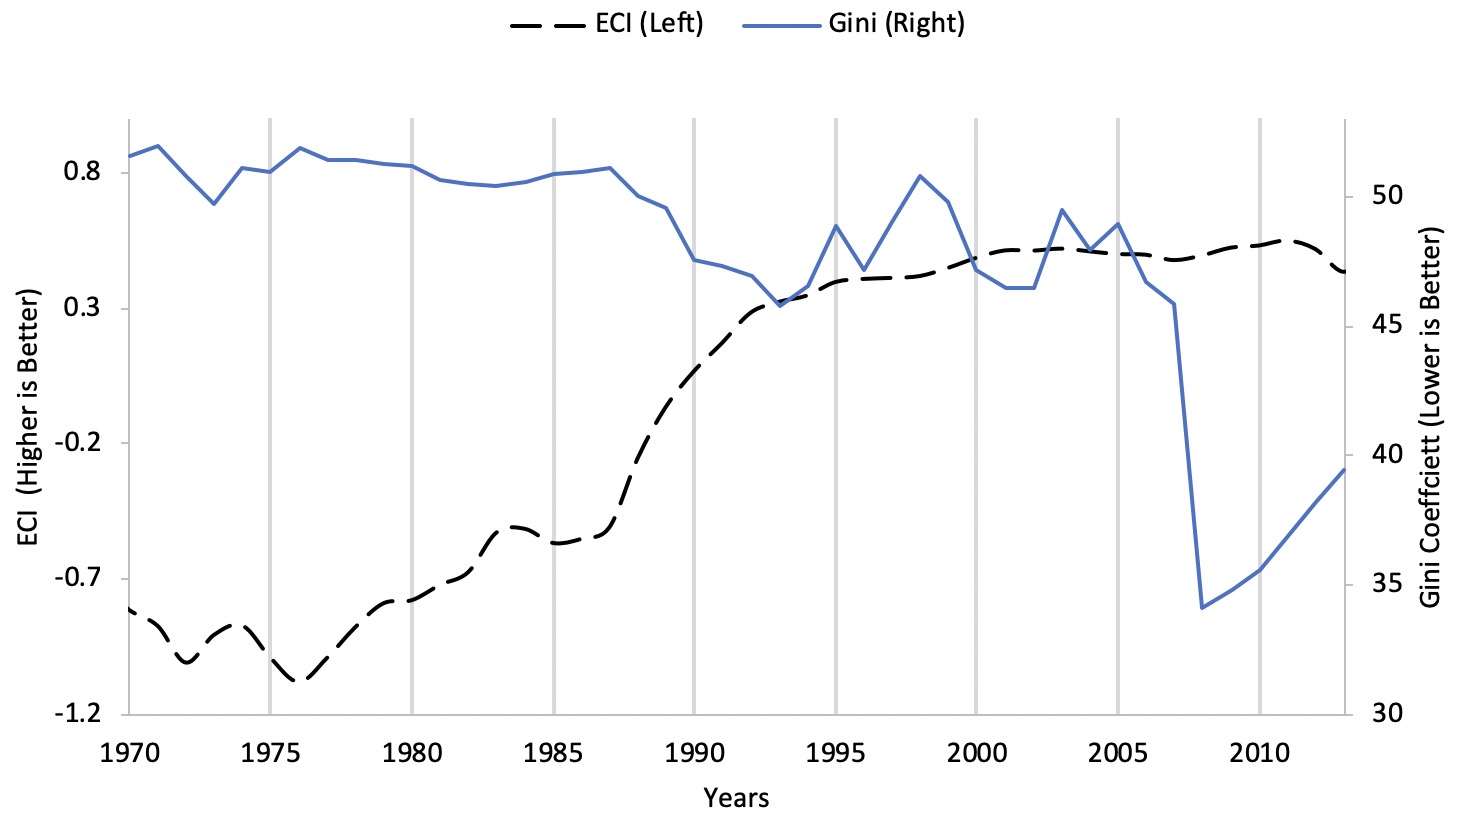
Figure 3: Economic Complexity and Income Inequality in Indonesia (1970-2013). Source: GINI EHII and the MIT Observatory of Economic Complexity The Indonesian economy rose from being the 96th most complex economy in the world in 1980 to the 65th most complex in 2010 (AJS & CA, 2011). This improvement in the productive structures of its economy corresponded to a substantial decline in income inequality, with the Gini coefficient falling from 51.19 (1980) to 35.57 (2010). Figure 3 illustrates changes in Indonesia’s Economic Complexity Index (ECI) and income inequality (Gini) coefficient from 1970 to 2013. The sustained rise in economic complexity in Indonesia coincided with its industrialization push in the mid-1980s. The Suharto administration devalued the rupiah (Indonesian currency) and deregulated the financial sector. These polices helped to aid export competitiveness by reducing the cost of exports and encouraging foreign investment. Suharto’s industrialization push came after the collapse of global oil prices in early 1980 and has reduced dependence on oil exports (Schwarz, 1999). The rise in economic complexity continued until the Asian Financial Crisis in mid-1997 when the Indonesian economy collapsed. It was particularly vulnerable due to a lack of formal state controls, specifically a pilot agency, such as the Ministry of International Trade and Industry (MITI) in Japan, which would have prioritized macroeconomic stability and mitigated the severe economic distortions that eventually eroded investor confidence in the Indonesian economy and led to substantial capital flight (Müller, 2014; Woo-Cumings, 1999)
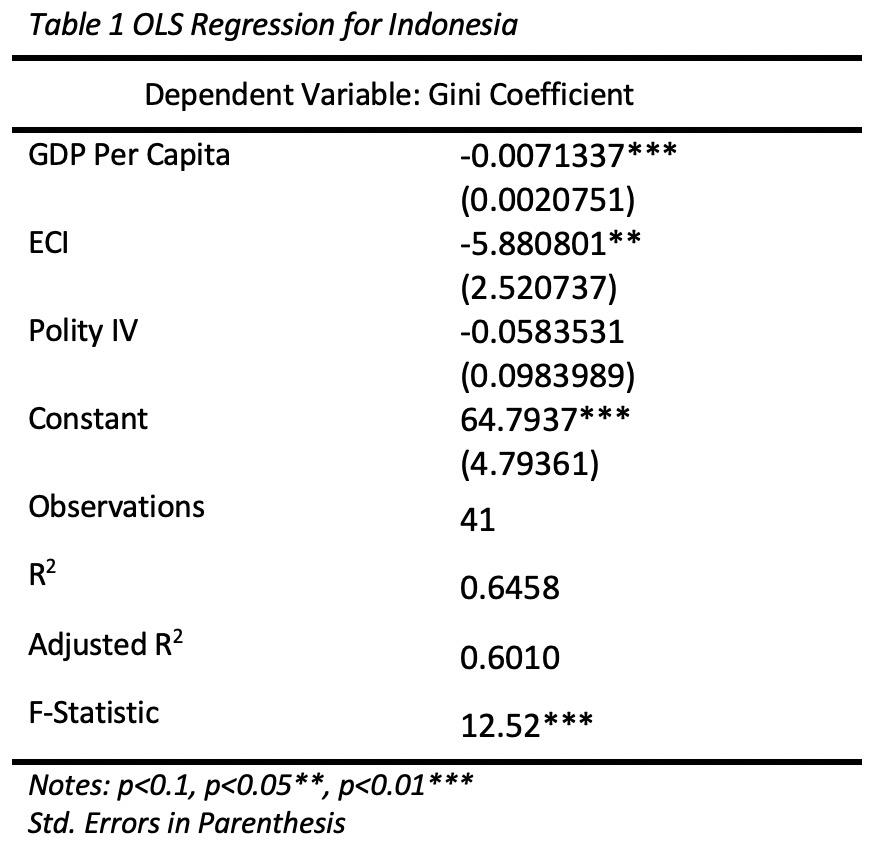
The regression analysis in Table 1 also shows that the Indonesian economy has followed the global general trend with higher economic complexity (ECI) being a significant predictor of lower income inequality as measured by the Gini. Overall the model has relatively high predictive value with an R2 value of 0.6448, indicating that 64.48% of the change in the dependent variable is due to change in the independent variables. The model specifies the parameter estimates below:
From the above results, we can see the most significant reduction in income inequality comes from an increase in GDP per capita, with the Economic Complexity Index coming in at a close second. This is consistent with previous research that has found a robust correlation between ECI and GDP per capita. An important consideration is that ECI is also shown to predict future economic growth, so improvements in productive structures have yielded both reductions in income inequality and greater levels of economic growth (Hartmann et al., 2017). Although the above regression analysis showed that Polity IV was not statistically significant at α = 0.1 for Indonesia, it still warrants mentioning. For much of the time period under consideration (1970-2013), Indonesia was considered an authoritarian regime, and only since Suharto’s resignation in 1998 after the Asian Financial Crisis (AFC) have we seen a strengthening of democratic processes that culminated in genuine elections. The Polity IV rose from -7 (autocracy) in 1997 to 6 (democracy) in 2004 after the presidential election. Note that from 1997 to 2013, there was no substantial improvement in economic complexity, but income inequality still fell from 48.98 to 39.47. Venezuela
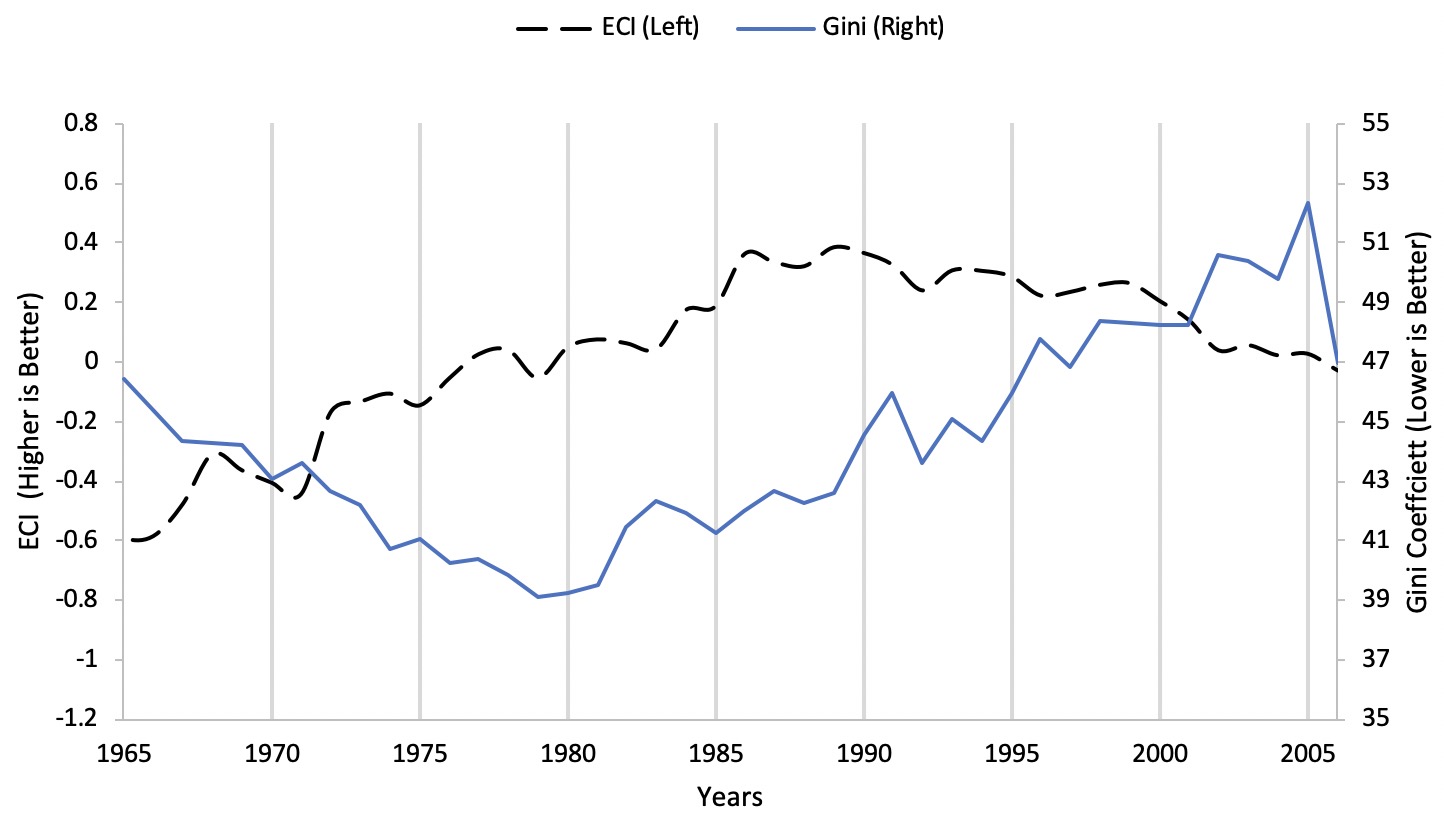
Figure 4: Economic Complexity and Income Inequality in Venezuela (1965-2006). Source: GINI EHII and the MIT Observatory of Economic Complexity The Venezuelan economy fell from the 91st (1980) most complex economy in the world to the 106th most complex in 2006(AJS & CA, 2011). This decline in the productive structures came with a gradual rise in the level of income inequality with the Gini coefficient rising from 39.23 (1980) to 46.64 (2006). This general rise in income inequality occurred despite substantial redistributive policies initiated by Hugo Chavez’s administration from 1999 to 2013 (Roth, 2016). Those same redistributive policies are likely responsible for throwing off the regression analysis in Table 2 where rises in ECI corresponds with a rise in income inequality (Gini coefficient). Figure 4 illustrates changes in the Economic Complexity Index (ECI) and income inequality (Gini) from 1965 to 2006. From 1965 to 1980, one can see that as economic complexity of the Venezuelan economy rose, income inequality fell, and the inverse is true from 1999 onwards. There is an anomalous period from 1980 to 1999 when there was a rise in ECI, but also a rise in income inequality, which is likely related to the global collapse of energy prices. During the 1980s, the surplus of crude oil caused by a combination of reduced demand and increased production led to substantial decline in the price of oil. Venezuela’s economy was (and continues to be) highly dependent on oil exports; the decline in oil prices destabilized the economy, and despite cycles of crisis and reform, the government was unable to stabilize the economy (Corrales, 1999). The outcome was slow growth with substantial inflation. Governmental corruption in Venezuela combined with hyperinflation left the government with little revenue to fund its expansive welfare programs that were initially responsible for lowering levels of income inequality (Buxton, 2014). The decline in government redistribution outstripped improvements in Venezuela’s productive structures that came from the government’s attempts to stabilize, liberalize and diversify the economy. The rapid decline in economic complexity from 1999 onwards was due to the Chavez administration’s policy of focusing the entire economy on oil production. The Venezuelan economy is currently highly dependent on oil revenues for both the government budget and the foreign exchange reserves needed to import all consumer goods because practically nothing but oil is produced in the country (Fisher & Taub, 2017b).
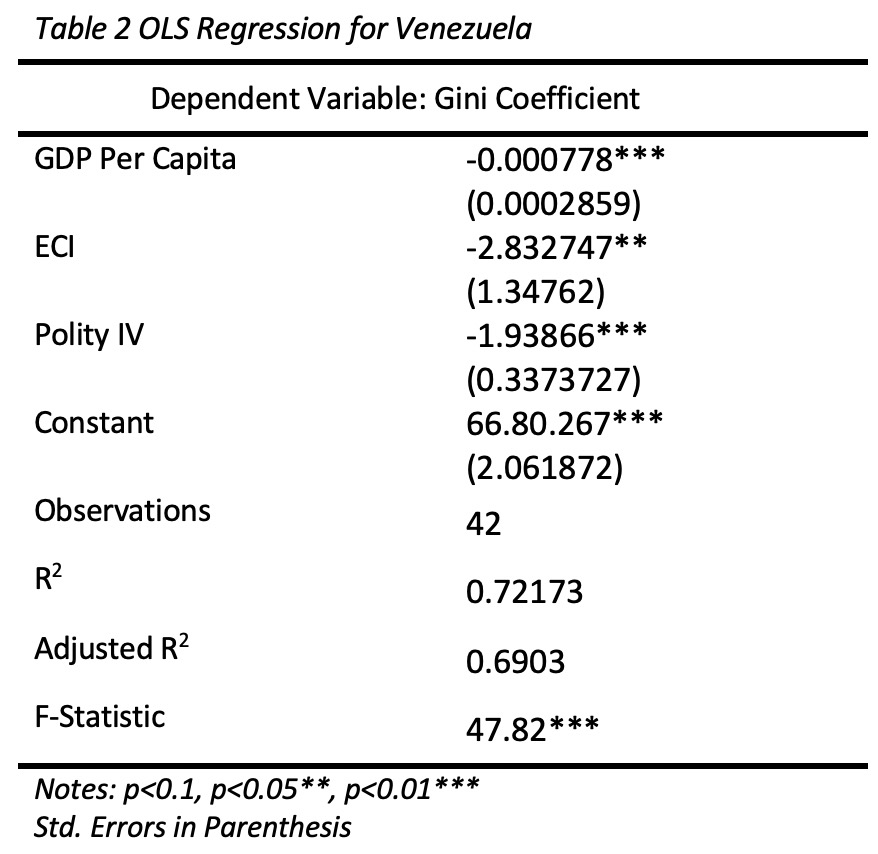
The regression analysis in Table 2 also shows that the Venezuelan economy deviates from the global general trend with higher economic complexity (ECI) being a significant predictor of lower income inequality as measured by the Gini. Overall, the model has a high predictive value with an R2 value of 0.7173 indicating, that 71.73% of the change in the dependent variable is due to change in the independent variables. The model specifies the parameter estimates below:
From the results, we can see the most significant reduction in income inequality comes from changes in Polity IV with increases in GDP per capita not having a significant impact on income inequality. An important consideration is that the maximum value of the Polity IV is 10, and for the time period under consideration (1964-2006), Venezuela only rose once in from a score of 6 in 1967 to 9 in 1970 until 1991 – after which it gradually fell to 5 in 2006. During the aforementioned period, the rise in the Polity IV coincided with a fall in income inequality from 44.35 (1967) to 43.08(1970) and hit a low of 39 in 1979. This period was marked by heavy government spending on social welfare programs enabled by the rapid rise in global oil prices, caused by an oil embargo from the Organization of Petroleum Exporting Countries (OPEC), of which Venezuela was a founding member (McCaughan, 2011). The reductions in income inequality in Venezuela have been enabled by governmental redistributive polices that are constrained by the underlying structure of the economy and vulnerable to the cyclical nature of oil prices. The positive correlation between ECI and the Gini coefficient does not necessarily indicate deficiencies in the approach, but corresponds to an anomaly where resource-rich nations violate global statistical trends. Generally, countries that exhibit greater economic complexity than expected, given their level of per capita GDP, tend to grow faster and have lower levels of income inequality. Venezuela and Saudi Arabia both deviate from this trend by having both higher GDP per capita and higher levels of income inequality than expected for their current level of economic complexity, since both countries have economies primarily based on oil (Hartmann et al., 2017). Note that several other countries in LA, like Brazil, also deviate from global trends because their economies rely heavily on commodity exportation. In this respect, Venezuela’s position of having relatively high per capita GDP, low complexity, and high levels of income inequality is the norm regionally even though it is a global outlier (Hartmann et al., 2016). DiscussionIndonesia has gradually risen from being a poor country with an undiversified, oil-reliant economy in the 1970s to the largest economy in Southeast Asia. This meteoric rise was enabled by its export-led growth model, and its success can be seen in how the export structure has changed from 1970 to 2010 (see Figure 5), diversifying away from commodity exportation to exporting both labor and capital-intensive goods. This economic modernization was initiated by the Suharto administration, whose policies helped to stabilize Indonesia’s currency and encourage foreign investment. Like other East Asian nations during the Cold War, Indonesia established an extensive economic and security relationship with the United States, which allowed for greater market access in the Cold War (Müller, 2014). Many of these critical policies were crafted by a group of Indonesian economists educated in the U.S. called the “Berkley Mafia.” Their placement in various semi-permanent technocratic positions enabled them to push for liberalization and deregulation both before and after the rise in oil prices in the 1970s. The ability of these technocrats to influence economic policy differed considerably from Venezuela where rapid changes in economic conditions (associated with large fluctuations in the price of oil) led to political crises and the election of new leaders that seldom maintained any consistency in policy. Unfortunately, economic diversification and growth did not yield improvements in political stability or personal freedoms. Indonesia was classified as autocracy and was led by President Suharto until 1997. While authoritarianism can overcome political constraints and mobilize the population to sacrifice current prosperity for the sake of developmental projects, this was never completely the case in Indonesia (Müller, 2014; Woo-Cumings, 1999). Rather than cultivate a relationship between the state and business through industrial policy, as in South Korea, it was done through ethnic division of labor with development, not for the sake of shared prosperity, but rather for the sake of payoffs. Suharto and his family were the owners of many conglomerates that benefited from export-led growth, and the minority ethnic Chinese that represented the business class or entrepreneurial element of the economy were under constant threat of persecution. Only after Suharto resigned in 1997 did democratization begin and Indonesians see a substantial rise in political stability and personal freedoms (Schwarz, 1999). Venezuela was once considered a shining example for Latin American countries in the 1950s as a wealthy, stable democracy. Decades later, the country and its economy are in ruins, with unprecedented hyperinflation and recession that has left most of the population on the brink of starvation (Fisher & Taub, 2017b). Despite a gradual improvement in smaller sectors of the Venezuelan economy, it remains more dependent than ever on crude oil exportation (see Figure 5). Like other Latin American nations, Venezuela has suffered from the resource curse (paradox of plenty), where oil wealth plagues non-resource-related development and inhibits institutional development (M. L. Ross, 1999). Despite governmental efforts supporting industrialization in the 1960s and ‘70s with import substitution policies, said policies never truly came to fruition. The failure of industrial policy can be partially linked to “Dutch disease”, where an increase in natural resource revenues undermines export-based manufacturing because substantial commodity exports cause exchange rate appreciation (Fardmanesh, 1991). This “disease” has pulled capital and labor from non-resource related sectors and made Venezuela further reliant on oil revenue. Politically, Venezuela was classified as a democracy until the early 2000s, but it is currently considered an authoritarian regime. Much of this regression occurred during the Chavez administration. Hugo Chavez, the former president of Venezuela, was a democratic populist who came to power in 1999 after two decades economic stagnation. Under Chavez’s rule, Venezuelans prospered through generous social welfare programs and redistributive policies funded through oil revenues (McCaughan, 2011). However, he became increasingly frustrated with courts blocking his legislation and media outlets criticizing his programs. Soon after, Chavez began to actively undermine the courts by removing judges, and he sought to silence journalists with anti-defamation laws. These discrete legal changes undermined Venezuelan democracy and centralized power with the executive branch of the government. Chavez’s actions have been characterized as in line with “democratic backsliding,” which is when the government attempt to systematically erode institutions like the press and independent judiciaries that enable democracy to function (Fisher & Taub, 2017a).
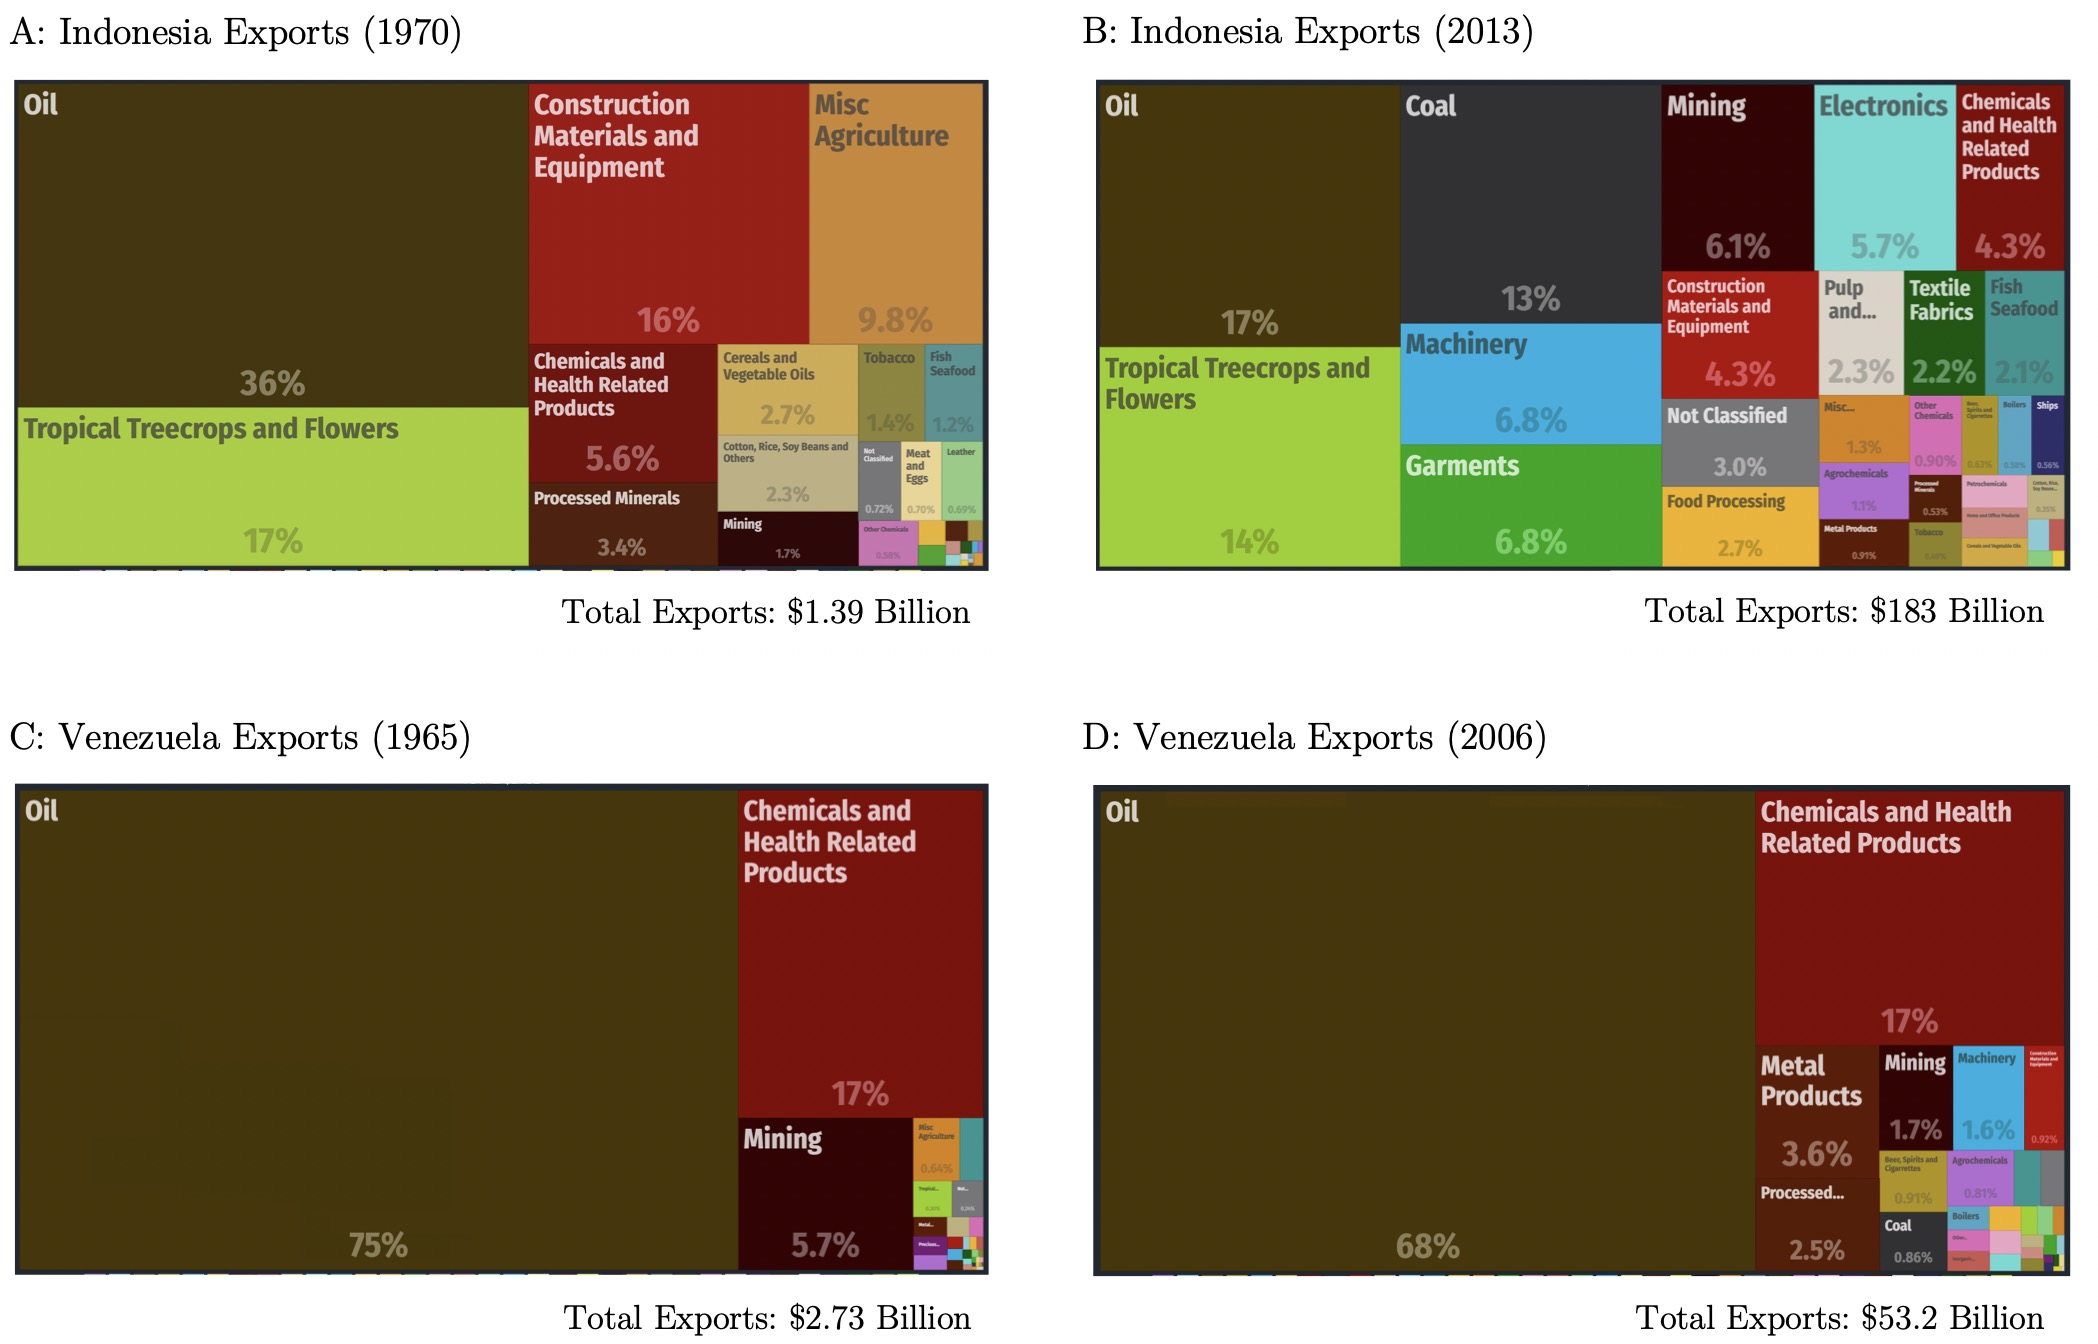
Figure 5: (A) Indonesia exports in 1970, (B) Indonesia exports in 2013, (C) Venezuela Exports in 1965 and (D) Venezuela exports in 2006. Source: atlas.media.mit.edu The divergent productive structures of Indonesia and Venezuela’s economies are a product of each country’s history, culture, and policies, but this also illustrates a broader disparity between countries in Latin America (LAC) and newly-industrialized High-Performing East Asian countries (HPEA). HPEA primarily went through the process of industrialization in the latter half of the twentieth century with consistent policies; however, Latin American countries, including Venezuela, have had waves of extreme industrialization through import-substitution followed by equally extreme efforts to liberalize and reform (Hartmann et al., 2016). Neither state intervention nor liberalization have successfully diversified LAC economies, which remain heavily dependent on natural resource extraction (Hartmann et al., 2016).
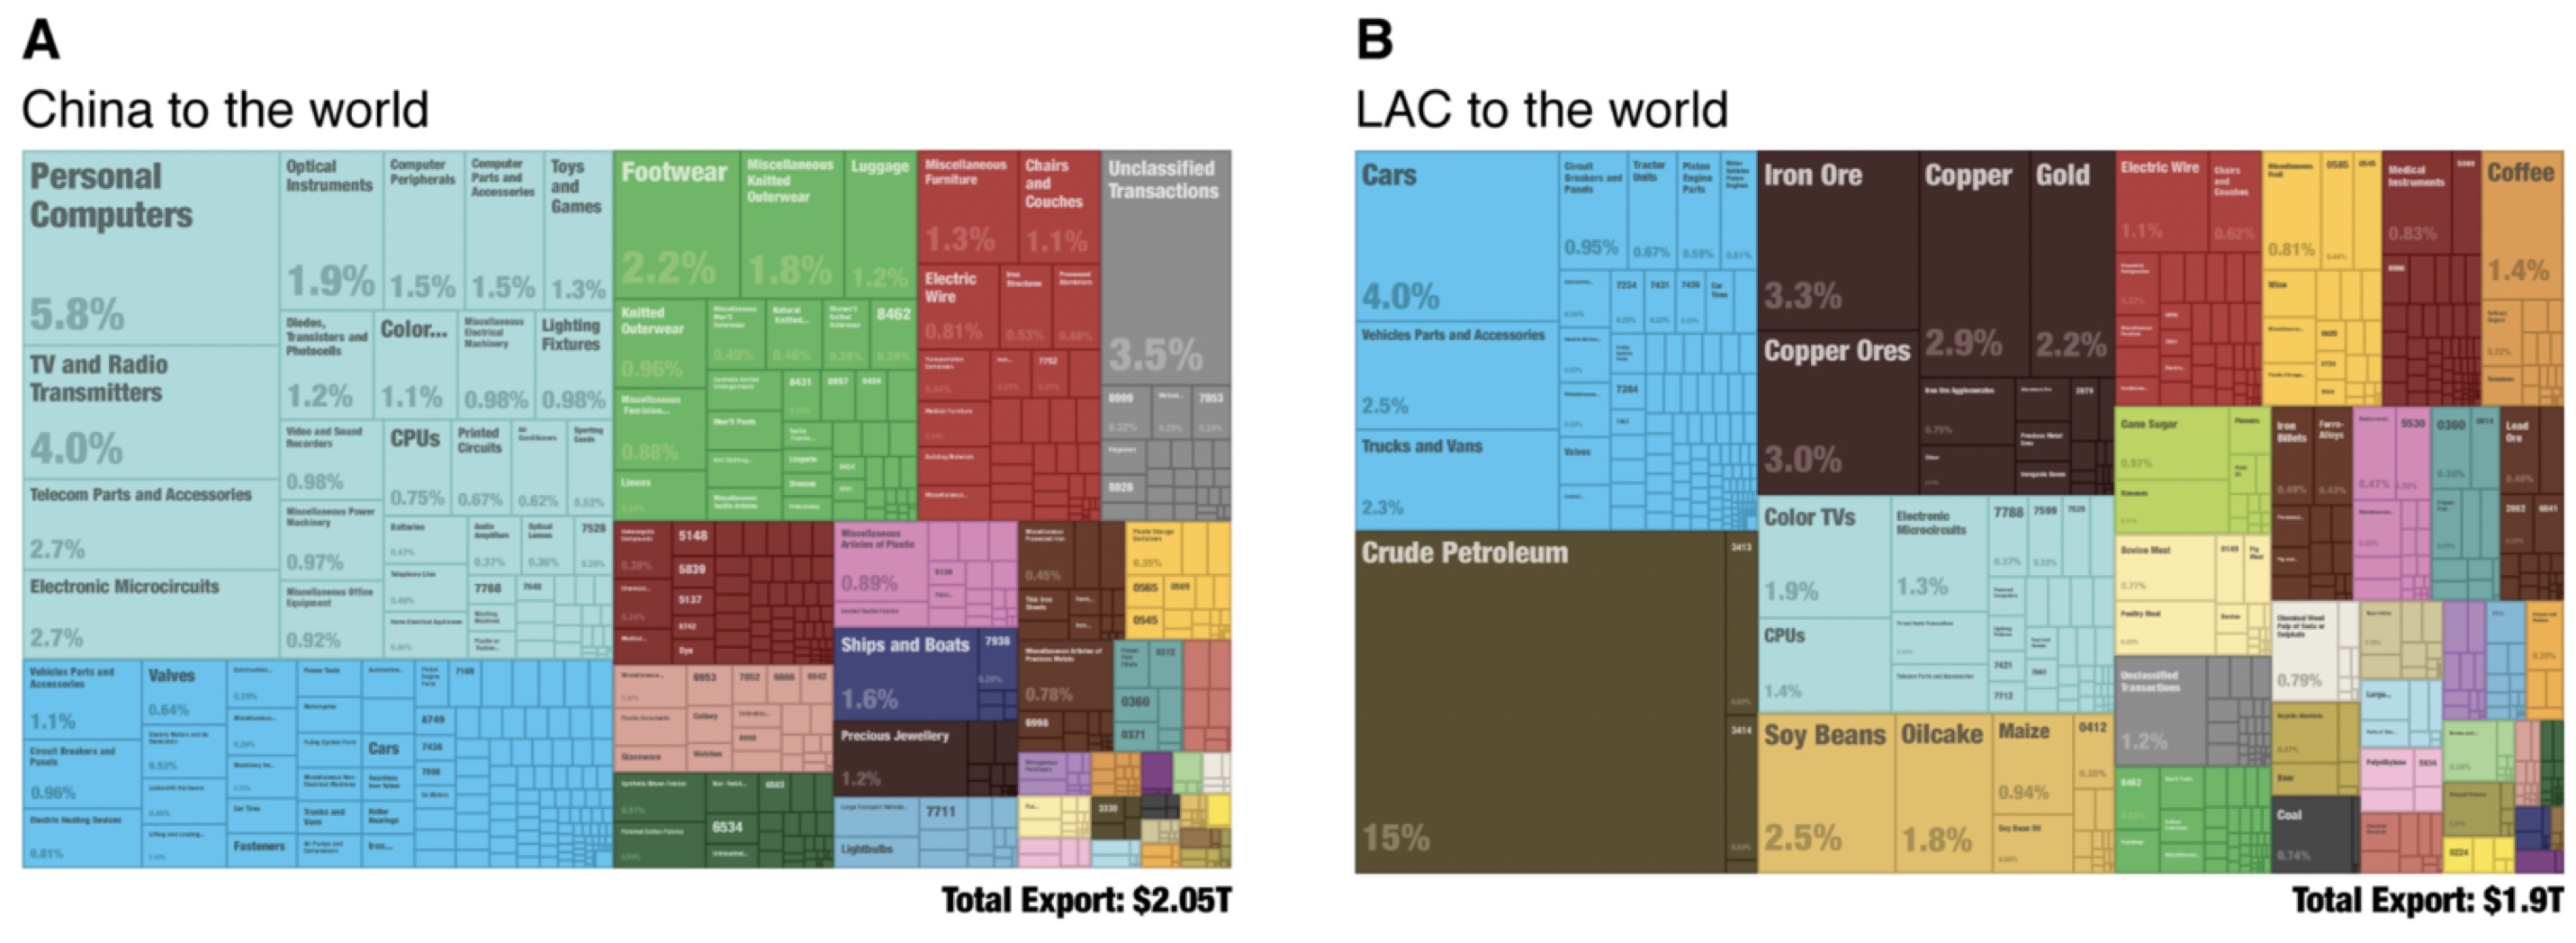
Figure 6: (A) Chinese exports to the world, (B) Latin America Countries’ (LAC) exports to the world from “The Structural Constraints of Income Inequality in Latin America” by D. Hartmann, Jara-Figueroa, Guevara, Simoes, & Hidalgo. Figure 6 illustrates the vast differences in the productive capabilities in between LAC and China. China’s exports primarily consist of complex machinery and other finished goods that require sophisticated factories and indicate a high degree of economic complexity. Latin American countries’ (LAC) exports consist largely of natural resources like crude oil, metals, and non-processed agricultural goods. While HPEA, like China, have diversified, LAC remain reliant on the exportation of commodities. These structural differences have serious implications for income inequality in both regions because the productive structures of an economy also act as structural constraints on income inequality. A country with high levels of economic complexity will usually not exhibit high levels of income inequality because the structure of the economy is more inclusive and is also not reliant on governmental redistributive policies to achieve lower income inequality (Hartmann et al., 2016). Many Latin American countries have had generous welfare policies that are intended to reduce income inequality, but these policies tend to be constrained since government revenues are usually reliant on no more than a few sectors of the economy (Hardesty, 2017). Venezuela is a commonly cited example because the Chavez and Maduro administrations focused the economy on oil production and attempted to use the revenues to fund programs and provide direct cash subsidies. However, despite these policies, income inequality has been rising since Chavez took office in 1998. Reliance on the concentrated economic power of the national oil industry led to rent-seeking behavior, mismanagement, and a grossly-unequal distribution of resources (McCaughan, 2011). The Venezuelan government maintained a monopoly on oil production by distributing the benefits and, therefore, feeding a relationship of dependency among citizens and private interests who, over time, became accustomed to thinking of oil wealth as something the government guarantees and thus its absence was deeply destructive. Low levels of economic complexity are accompanied by high levels of income inequality because the structure of the economy is less inclusive and economic power more concentrated. Thus, redistributive policies to achieve lower income inequality have hard limits and must be accompanied by efforts to diversify the economy (Hartmann et al., 2016). Resource-rich European Welfare States like Norway have succeeded in part because they were able to use oil wealth to diversify their economies. Since the 1970 oil boom, the Norwegian government has provided funding and established incentives to aid the development of shipping, engineering, and drilling technologies. This formed the foundation for growth across a range of other industries, including fish farming, bio-refining, logging, and mining. Non-resource-rich European nations, like Finland, have also succeeded by making large investments in human capital and becoming research and development centers for technology (López, 2017). There exist inextricable links between political and economic development that are shown to have a substantial impact on the level of income inequality both within individual nations and across regions. This case study of Indonesia and Venezuela illustrates how both nations have diverged and are proxies for broader economic and political trends across Latin America and East Asia. Literature on cross-national and regional similarities and differences have emphasized per capita economic performance, with less attention given to nations with comparable levels of per capita GDP but vastly different distributions of income. This omission was in part related to contemporary economic thinking which saw distribution of income as less relevant and primarily impacted by government redistributive policies rather than the underlying structure of the economy. A larger study involving panel data from Latin America Countries (LAC) and High Performing Asia Economies (HPEA) should be done to better understand the impact of diverging economic development on income inequality in these regions. ReferencesAJS, S., & CA, H. (2011). The Economic Complexity Obervatory: An Analytical Tool for Understanding the Dynamics of Economic Development. Workshops at the Twenty-Fifth AAAI Conference on Artifical Intelligence. Retrieved September 1, 2018, from https://atlas.media.mit.edu/en/resources/permissions/ Albeaik, S., Kaltenberg, M., Alsaleh, M., & Hidalgo, C. A. (2017). Improving the Economic Complexity Index. Arixv Working Paper (Vol. arXiv:1707). Retrieved from http://arxiv.org/abs/1707.05826 Buxton, J. (2014). Social policy in Venezuela: Bucking neoliberalism or unsustainable clientelism. UNRISD Working Paper 2014-16, (November). Retrieved from http://link.springer.com/chapter/10.1057/978-1-137-53377-7_13 Center for Systematic Peace Polity IV Datset. (2013). Retrieved September 1, 2018, from http://www.systemicpeace.org/inscrdata.html Corrales, J. (1999). Venezuela in the 1980s, the 1990s and beyond. Harvard Review of Latin America, pp. 26–29. Retrieved from https://revista.drclas.harvard.edu/book/venezuela-1980s-1990s-and-beyond Fardmanesh, M. (1991). Dutch disease economics and oil syndrome: An empirical study. World Development, 19(6), 711–717. https://doi.org/10.1016/0305-750X(91)90205-V Fisher, M., & Taub, A. (2017a). How Does Populism Turn Authoritarian? Venezuela Is a Case in Point. Retrieved September 1, 2018, from https://www.nytimes.com/2017/04/01/world/americas/venezuela-populism-authoritarianism.html Fisher, M., & Taub, A. (2017b). How Venezuela went from the richest economy in South America to the brink of financial ruin. Retrieved September 1, 2018, from https://www.independent.co.uk/news/long_reads/how-venezuela-went-from-the-richest-economy-in-south-america-to-the-brink-of-financial-ruin-a7740616.html Gala, P., Rocha, I., & Magacho, G. (2018). The structuralist revenge: economic complexity as an important dimension to evaluate growth and development. Brazilian Journal of Political Economy. https://doi.org/10.1590/0101-31572018v38n02a01 GINI EHII. (2015). Retrieved July 20, 2012, from https://utip.lbj.utexas.edu/data.html Hardesty, L. (2017). Income inequality linked to export “complexity.” Retrieved September 1, 2018, from http://news.mit.edu/2017/income-inequality-linked-export-complexity-0217 Hartmann, D., Guevara, M. R., Jara-Figueroa, C., Aristarán, M., & Hidalgo, C. A. (2017). Linking Economic Complexity, Institutions, and Income Inequality. World Development, 93(September), 75–93. https://doi.org/10.1016/j.worlddev.2016.12.020 Hartmann, D., Jara-Figueroa, C., Guevara, M., Simoes, A., & Hidalgo, C. A. (2016). The structural constraints of income inequality in Latin America. Integration & Trade Journal, (40), 70–85. Retrieved from https://publications.iadb.org/handle/11319/7667?locale-attribute=en Hausmann, R., Hidalgo, C. A., Bustos, S., Coscia, M., Chung, S., Jimenez, J., … Yildirim, M. A. (2011). The Atlas of Economic Complexity. Hidalgo, C. A., & Hausmann, R. (2009). The building blocks of economic complexity. Proceedings of the National Academy of Sciences, 106(26), 10570–10575. https://doi.org/10.1073/pnas.0900943106 Hidalgo, C., & Simoes, A. (2018). The Observatory of Economic Complexity. Ilter, C. (2017). What Economic and Social Factors Affect GDP Per Capita? A Study on 40 Countries. Ssrn, 1–13. https://doi.org/10.2139/ssrn.2914765 López, L. (2017). Oil Has Cursed Venezuela—But Could Also Save the Country. The Atlantic. Retrieved from https://www.theatlantic.com/international/archive/2017/12/fixing-venezuela/548465/ McCaughan, M. (2011). The Battle of Venezuela. New York: Seven Stories Press. Retrieved from http://books.google.ch/books?id=VdYHt8EBsJUC Mcgreevey, W. (2013). Angus Deaton, The Great Escape: Health, Wealth, and the Origins of Inequality. Population and Development Review, 39(4), 717–721. https://doi.org/10.1111/j.1728-4457.2013.00638.x Mealy, P., Farmer, J. D., & Teytelboym, A. (2017). A New Interpretation of the Economic Complexity Index. SSRN. https://doi.org/10.2139/ssrn.3075591 Müller, A. R. (2014). South Korea: Food security, development and the developmental state. New Challenges to Food Security: From Climate Change to Fragile States, (Timmer 2005), 298–320. https://doi.org/10.4324/9780203371176 Natarajan, G. (2013). An assessment of “The Economic Complexity Atlas.” Retrieved from http://gulzar05.blogspot.com/2013/03/an-assessment-of-economic-complexity.html Ross, M. L. (1999). The political economy of the resource curse. World Politics, 51(2), 297–322. https://doi.org/10.1017/S0043887100008200 Ross, M. L. (1999). The political economy of the resource curse. World Politics, 51(2), 297–322. https://doi.org/10.1017/S0043887100008200 Roth, C. (2016). Venezuela’s Economy Under Chavez, by the Numbers. Retrieved September 1, 2018, from https://blogs.wsj.com/economics/2013/03/06/venezuelas-economy-under-chavez-by-the-numbers/ Salna, K., & Rusmana, Y. (2017, August 14). Whatever Happened to Indonesia’s Mightly Oil and Gas Industry? Bloomberg News. Retrieved from https://www.bloomberg.com/news/articles/2017-08-14/whatever-happened-to-indonesia-s-mighty-oil-and-gas-industry Schwarz, A. J. (1999). A Nation in Waiting: Indonesia in the 1990s. Boulder: Westview Press. Woo-Cumings, M. (1999). The Developmental State. Cornell Studies in Political Economy. World Bank. (2016). The World Bank DataBank. Retrieved September 1, 2018, from http://databank.worldbank.org/data/home.aspx Appendix
From the Inquiries Journal Blog  ") Related ReadingMonthly Newsletter SignupThe newsletter highlights recent selections from the journal and useful tips from our blog. Suggested Reading from Inquiries Journal
Inquiries Journal provides undergraduate and graduate students around the world a platform for the wide dissemination of academic work over a range of core disciplines. Representing the work of students from hundreds of institutions around the globe, Inquiries Journal's large database of academic articles is completely free. Learn more | Blog | Submit Follow IJ
Latest in Economics |